Resistance Zone Grows Stronger
Signs of a potential bearish continuation in gold remain dominant, with resistance confirmed near the falling 20-day moving average for the fifth consecutive session. On Tuesday, gold established a lower daily high of $4,103, finding resistance near the 20-day moving average. However, there was a subtle difference in today’s test of resistance near that average: the falling 10-day moving average also acted as resistance after converging with the 20-day moving average, placing both indicators at nearly the same price level.
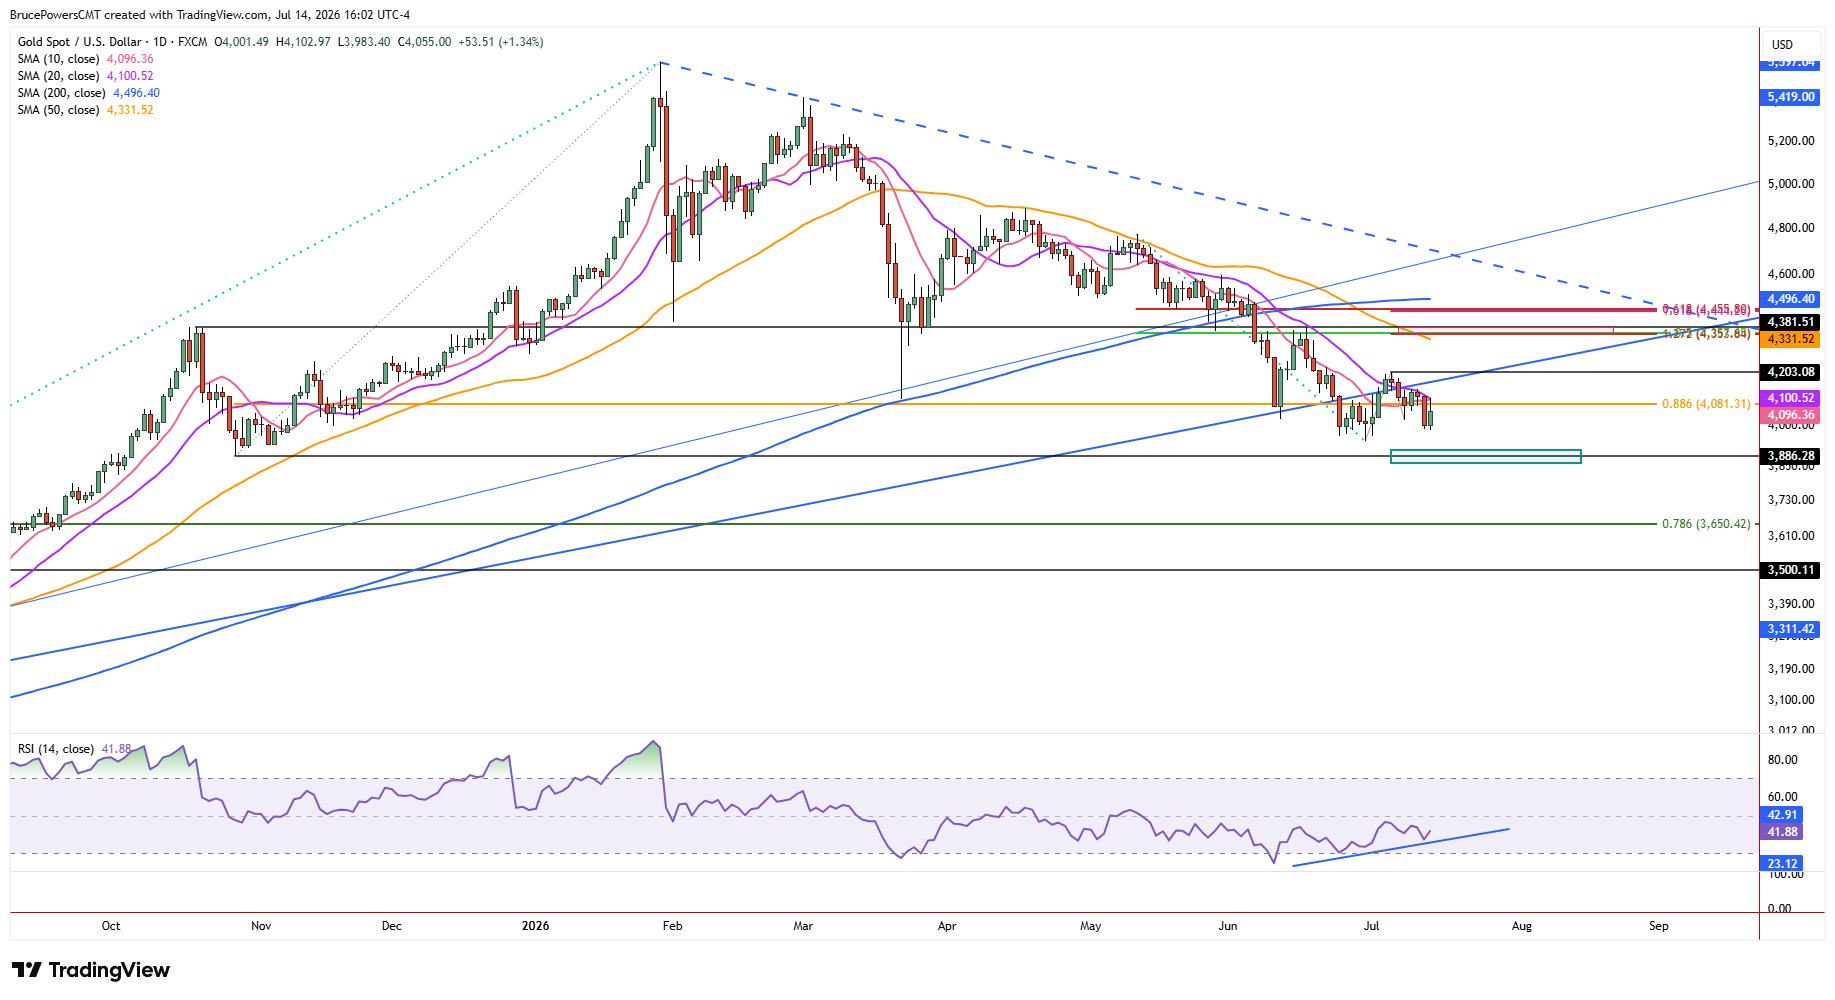
With the two averages aligned, they define a stronger resistance area and a slightly more significant pivot zone if gold attempts an upside breakout. Therefore, a decisive rally above Tuesday’s high would signal a breakout above both the 10-day and 20-day moving averages. However, that advance would quickly encounter an interim lower swing high at $4,138 as well as the long-term uptrend line, which recently failed as support.

Key Downside Targets Remain in Focus
The bearish trend structure continues to favor a downtrend bounded by dynamic resistance at the 20-day moving average. A failure to recover the uptrend line and the moving average last week confirmed that sellers remain in control. At the same time, the next lower target zone extends down to the higher swing low of $3,886 from October of last year. To date, the corrective low stands at $3,942 from two weeks ago. That decline left gold down 29.6% from its January peak of $5,597.
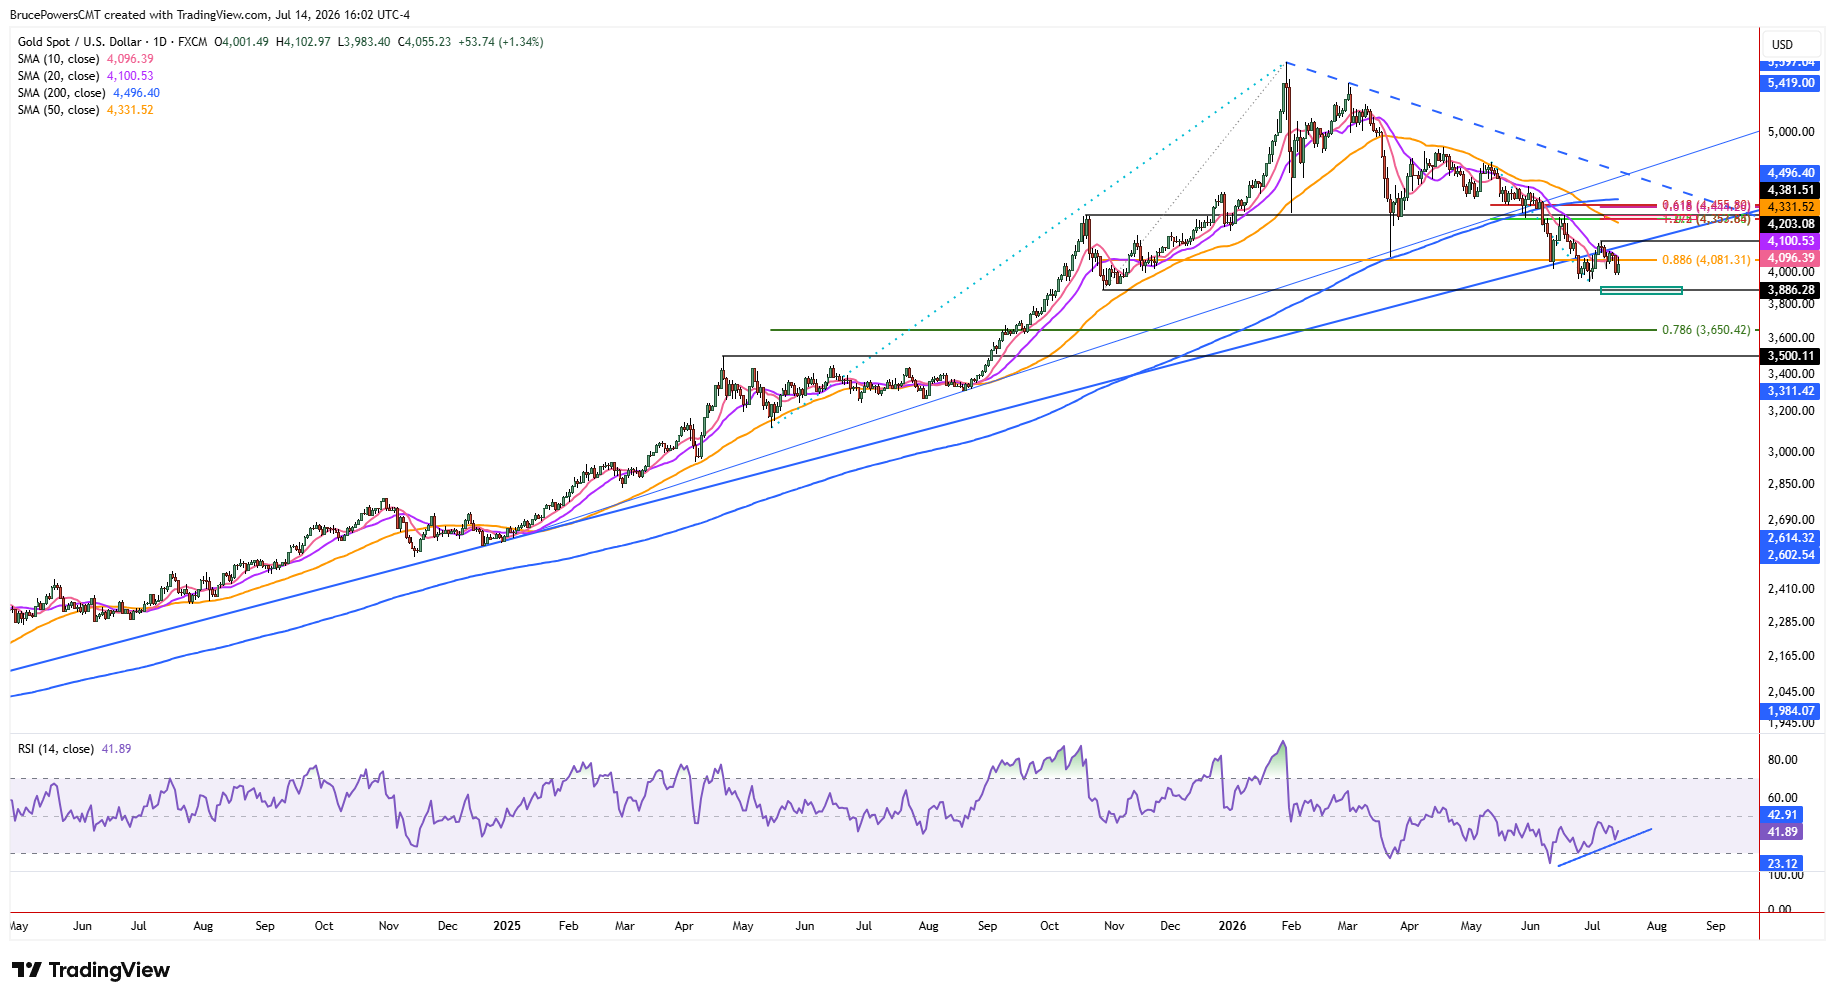
If the October low fails as support, the 78.6% Fibonacci retracement at $3,650 becomes the next downside target. A decline below the October low would also trigger another bearish trend continuation signal by violating the prior uptrend’s higher swing low. In that case, the prior resistance range beginning at $3,500 would become a potential downside target zone.
Bullish Scenario Requires Multiple Breakouts
Despite the potential downside, a decisive advance above Tuesday’s high, before a decline below Tuesday’s low of $3,983, may result in a higher swing low. If that is followed by further signs of strength, including a rally above the interim lower swing high of $4,138 and the former uptrend line, bullish sentiment may continue to improve. An advance above $4,138 also increases the likelihood of a bullish trend continuation signal if gold subsequently breaks above the recent lower swing high at $4,203. Until then, the bearish technical structure remains intact, with the 20-day moving average continuing to define an initial key resistance zone that bulls must overcome.
If you’d like to know more about how to trade gold and silver, please visit our educational area.