Early Breakout Signals Shift Momentum
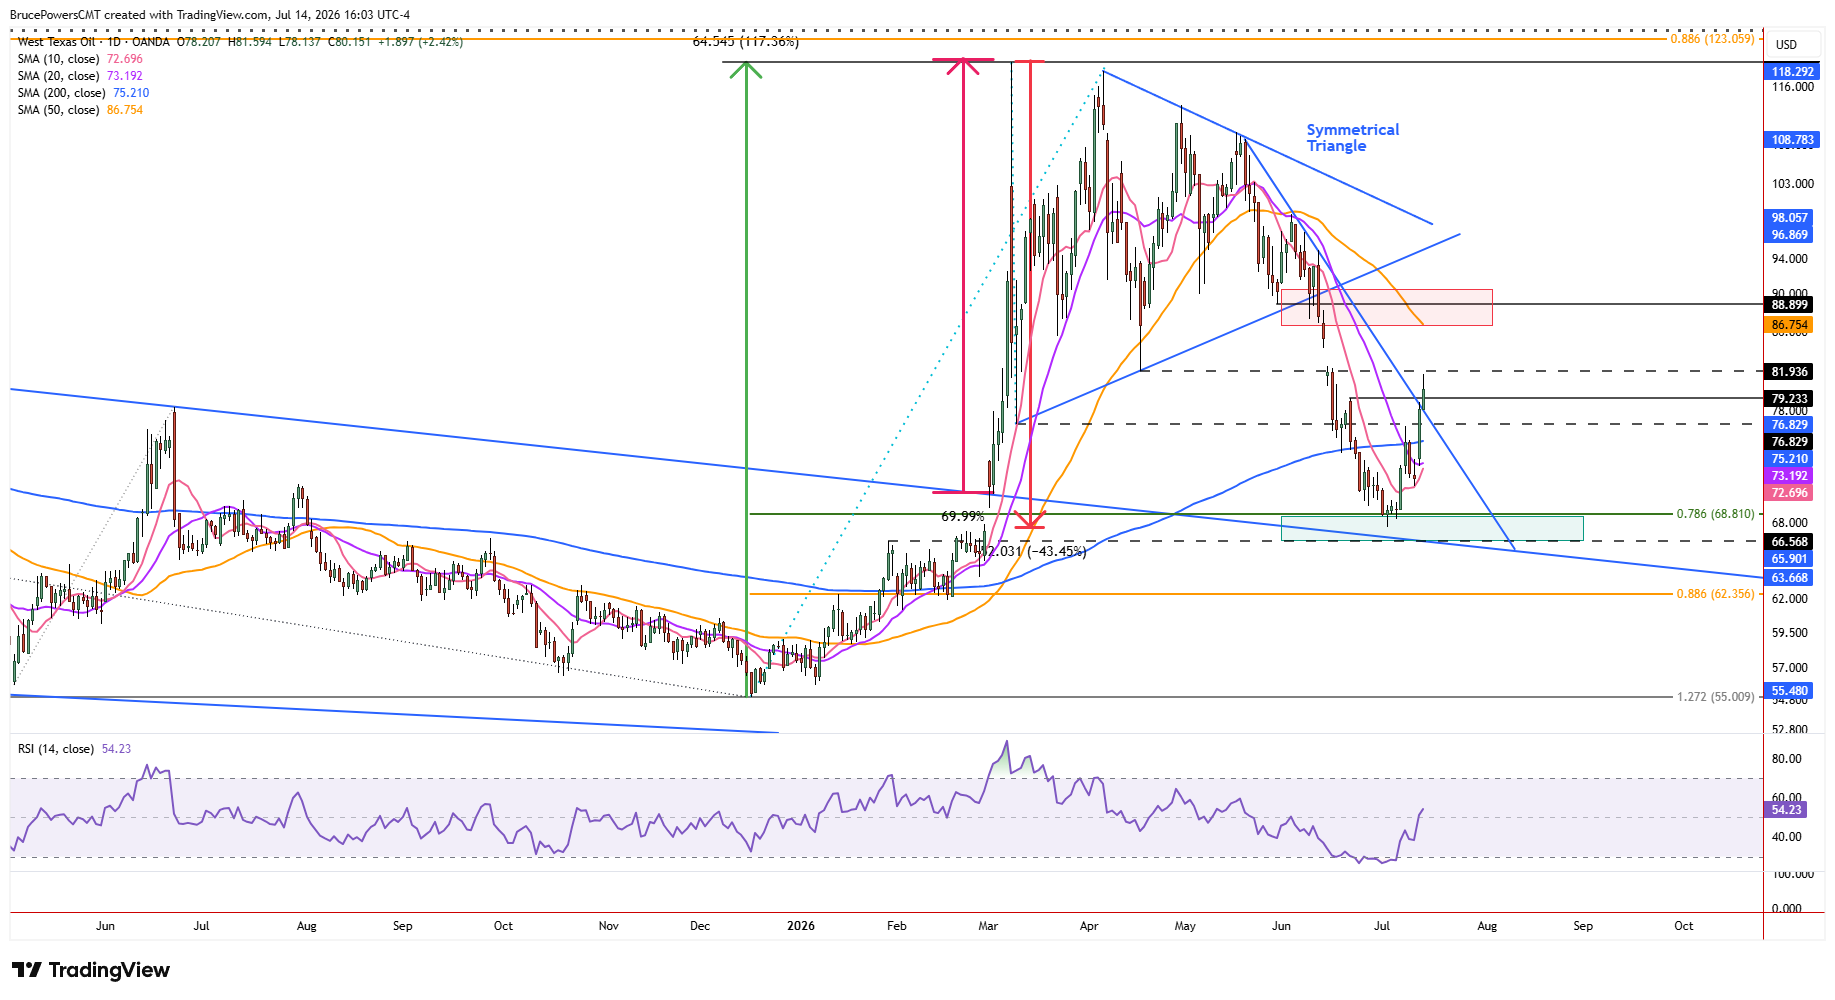
Crude oil rallied to a high of $81.59 on Tuesday before encountering resistance and pulling back intraday. During the advance, strength was confirmed by two bullish signals. There were upside breakouts of the downtrend line and a bullish reversal above the lower swing high at $79.23. Daily closes above each indicator will confirm the respective breakouts. Tuesday’s higher daily low of $78.14 can be used as a proxy for the downtrend line, as it shows support was established at the trendline.
Trend Structure Improves as Buyers Regain Control
The reversal of the trend structure, with a rally above a prior lower swing high, was the first break above a lower swing high since the bottom of $67.73. Since it was aligned with a trendline recovery, the bullish implications are somewhat stronger. The session high reached an upside target near the April swing low of $81.94, and given the intraday bearish reaction, the market recognized that price zone. Nevertheless, the new bullish signals suggest improving bullish momentum that should be strong enough to eventually break above that price zone and move toward higher initial targets.
Resistance Levels Define the Next Test
Initial upside targets are defined by the falling 50-day moving average near $86.70 and the trigger area for a breakdown of a symmetrical triangle consolidation pattern near the interim swing low of $88.90. A sustained recovery of the 50-day average would be needed before there was a chance for higher prices.
The longer-term outlook has improved during the recovery from the recent trend low of $67.73, as evidenced by the sustained reclaim of the 200-day moving average, following a drop below the average. It now represents a key support area near $75.11. The shorter 20-day moving average was reclaimed during the current advance and confirmed as support with Monday’s higher swing low of $72.94.
A Potential Second Leg Higher Emerges
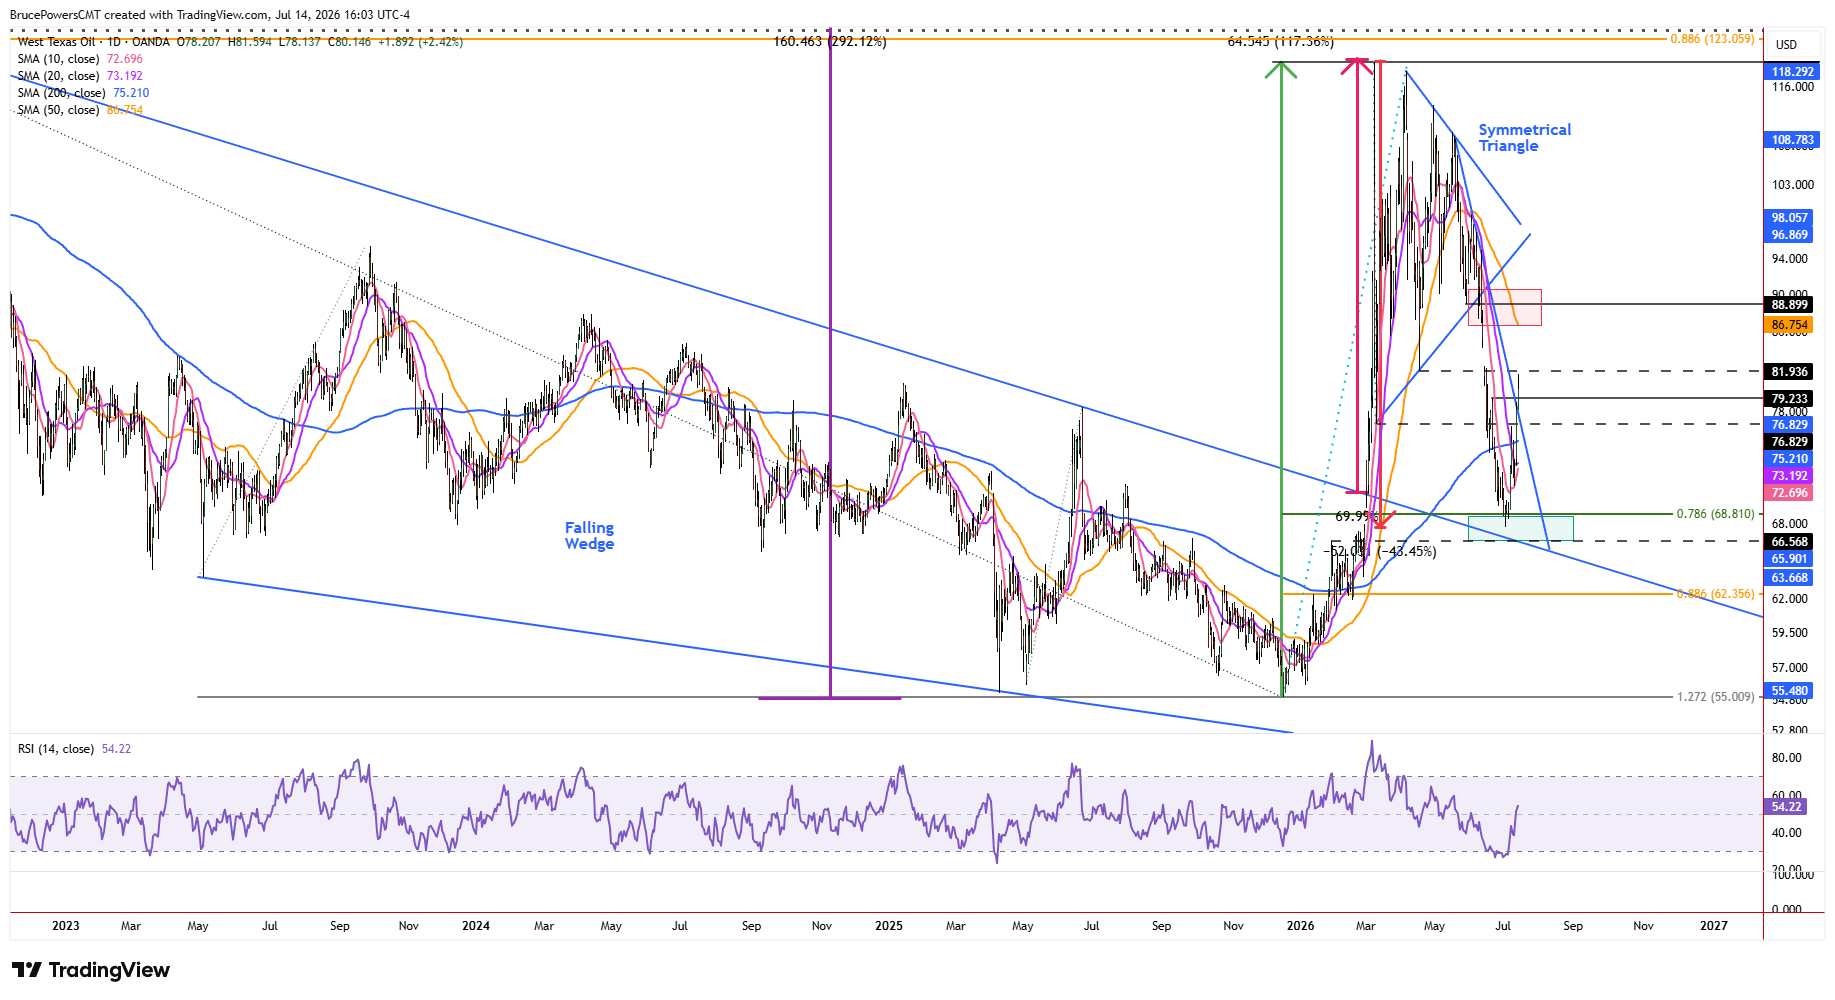
There has been one leg up in crude oil following the upside breakout of a multi-year bearish correction at the beginning of March, which took the form of a bullish falling wedge. When measured from the trendline breakout level of $70.49, crude oil spiked by over 69% to a peak of $119.54 five days later. The current advance is the second leg up following the breakout.
WTI Crude Oil Price Forecast
Every new WTI Crude Oil analysis as it publishes, today's technical signal and key levels, live price — on one page.
See all WTI Crude Oil forecastsAlthough upside volatility may not match the magnitude of the initial surge, this does suggest that a second leg up could also see signs of buyer enthusiasm. With the recent breakout signals emerging, the focus shifts to whether the recovery can extend beyond initial resistance levels and confirm a broader continuation of the bullish trend.