
SOX Pullback Nearly Matches Elliott Wave Target
In our June 25 update on the semiconductor index (SOX), we found, using the Elliott Wave Principle (EWP), that
“the June 22 high is now labeled red Wave-iii [W-iii], and red Wave-iv [W-iv] is now underway, ideally targeting $10,870 – $11,765”
Fast-forward to today: the index bottomed at $11,960 on July 7 (see Figure 1 below). Using the EWP, we forecast the next move days in advance with 98% accuracy. Thus, the series of updates we’ve presented for the SOX, using forward returns and the EWP since late April, remains on track.

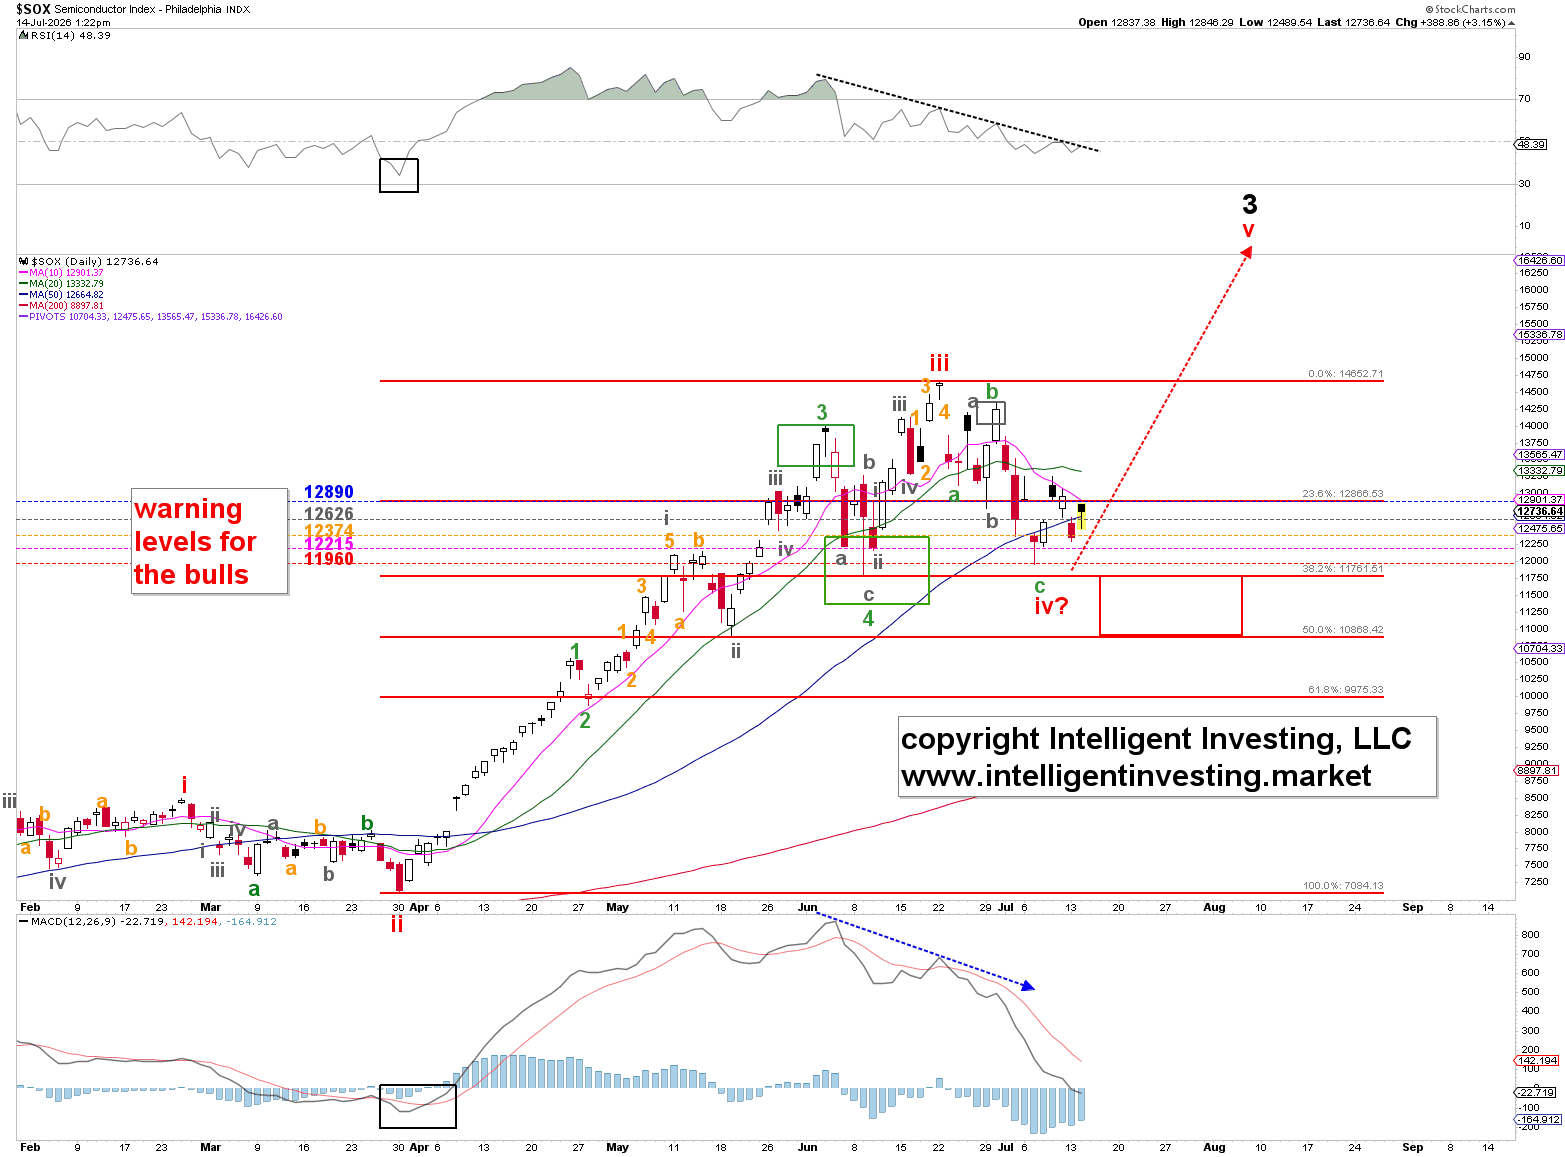
Bulls Eye New Highs as Key Support Levels Define the Path
Thus, the red W-iv can be considered complete, and red Wave-v to new All-time highs could be underway, contingent on holding above the July 7 low.
Zooming in, and knowing that corrections can always become more complex, i.e., after three waves lower expect at least three waves back up, we can allow for only a counter-trend rally (B-wave) to ~$13,590-14,390 comprising of three waves (gray W-a, -b, and -c), with W-a at the July 9 high of $13,249, W-b at yesterday’s low ($12,289) and W-c now underway to ~$13,590-14,390 depending on a c=a or c=1.618x a extension. See Figure 2 below.
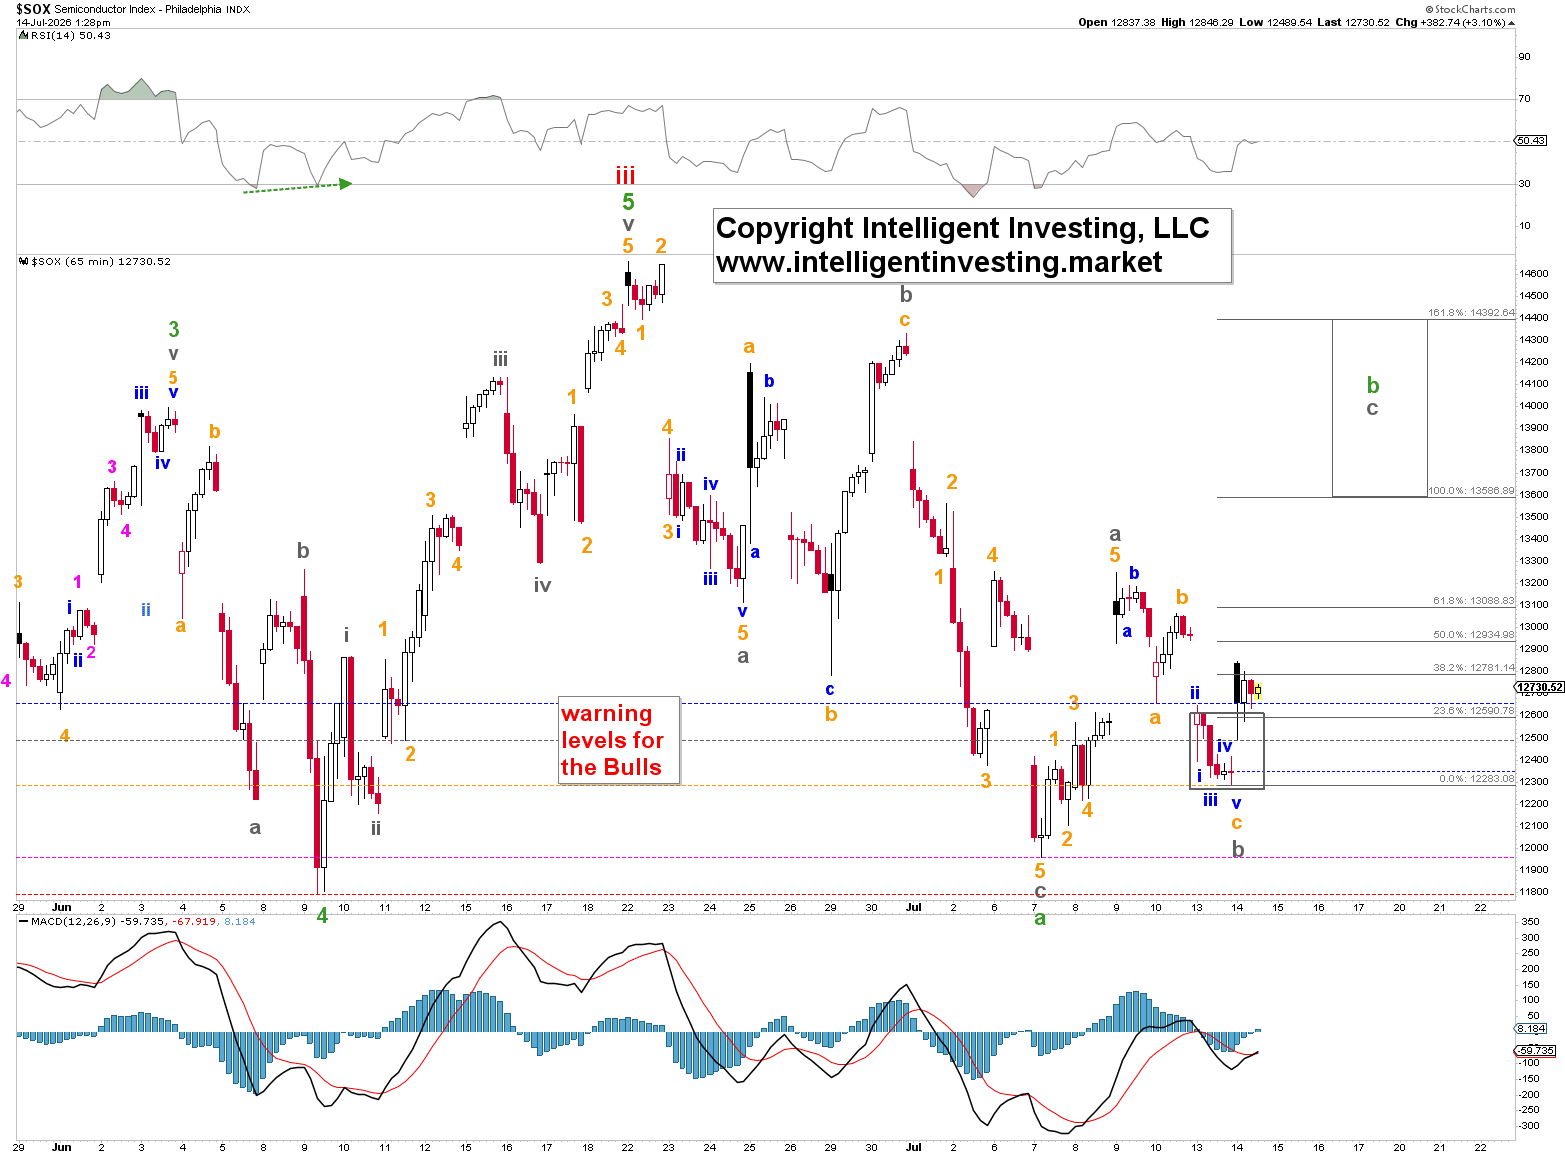
The bounce scenario requires the index to hold above last week’s low as well because a break below that price level targets, ideally, approximately $10,500-600 before the Bulls can try again. Meanwhile, a breakout above last week’s high ($13,250) is still needed for both paths to play out. Thus, we have two plausible scenarios looking for higher prices, and we have clear warning levels (i.e., stop-loss levels) to indicate that our thesis/position was wrong.