The short-term direction of the gold market is likely to be determined by trader reaction to the 50% level at $1744.30.
Gold futures are inching higher late Tuesday in a mostly lackluster trade as investors square positions ahead of the Fed interest rate and monetary policy announcements on Wednesday. Traders also monitored the price action in the U.S. Treasury and the U.S. Dollar Index futures markets, which was mostly two-sided trading.
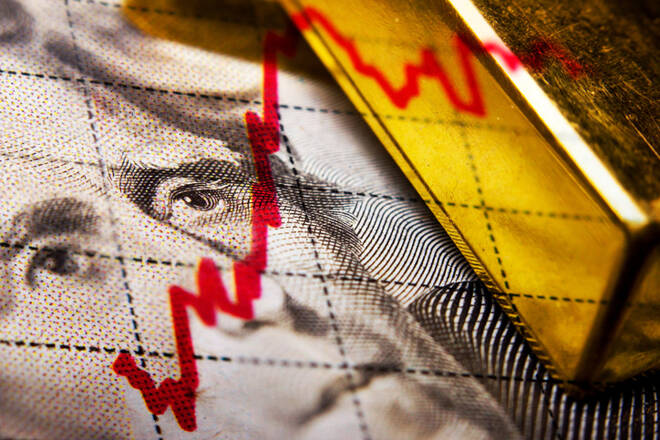
At 20:04 GMT, April Comex gold futures are trading $1730.40, up $1.20 or +0.07%.
The U.S. Federal Open Market Committee’s two-day meeting ends on Wednesday. The central bank is expected to reiterate its pledge to keep interest rates pinned near zero until the economy reaches full employment.
Gold could be building a support base despite the possibility of higher Treasury yields. Buyers could be betting on a surge in U.S. inflation that offsets the rise in yields.
The main trend is down according to the daily swing chart, however, momentum shifted to the upside on Tuesday. A trade through $1815.20 will change the main trend to up. The downtrend will resume on a move through $1673.30.
The minor trend changed to up on Tuesday when buyers took out a pair of minor tops at $1738.00 and $1739.10. This shifted momentum to the upside.
On the downside, the key support is the long-term Fibonacci level at $1711.70.
The short-term range is $1815.20 to $1673.30. Its 50% level at $1744.30 is potential resistance and a trigger point for an acceleration to the upside.
The major upside target and potential resistance is the long-term 50% level at $1787.30.
The short-term direction of the gold market is likely to be determined by trader reaction to the 50% level at $1744.30.
A sustained move over $1744.30 will indicate the presence of buyers. If this move creates enough upside momentum then look for a potential acceleration to the upside with $1787.30 the next likely target.
A sustained move under $1744.30 will signal the presence of sellers. This could trigger a quick break into the major Fibonacci level at $1711.70. Trading below this level could shift the bias to the downside.
James Hyerczyk is a U.S. based seasoned technical analyst and educator with over 40 years of experience in market analysis and trading, specializing in chart patterns and price movement. He is the author of two books on technical analysis and has a background in both futures and stock markets.