


Consolidation Beneath Resistance Intensifies
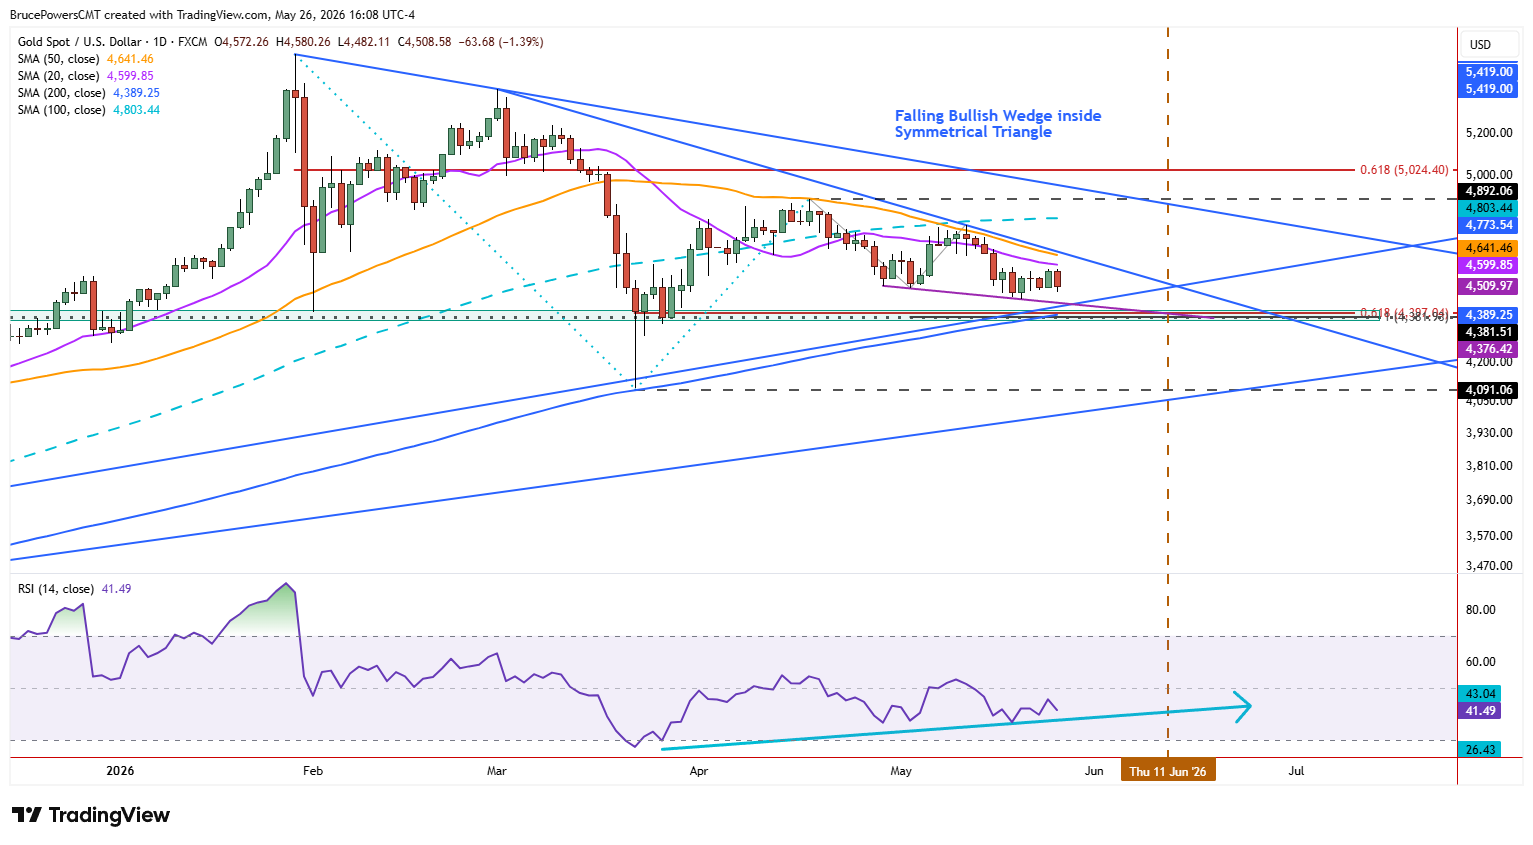
Price compression in gold continued on Tuesday, as it extended a relatively tight range that has formed just below resistance defined by the 20-day moving average. There are three trendlines that define key parameters of support and resistance, creating two overlapping structural frameworks to monitor as price action develops.

Triangle Structure Near Inflection Point
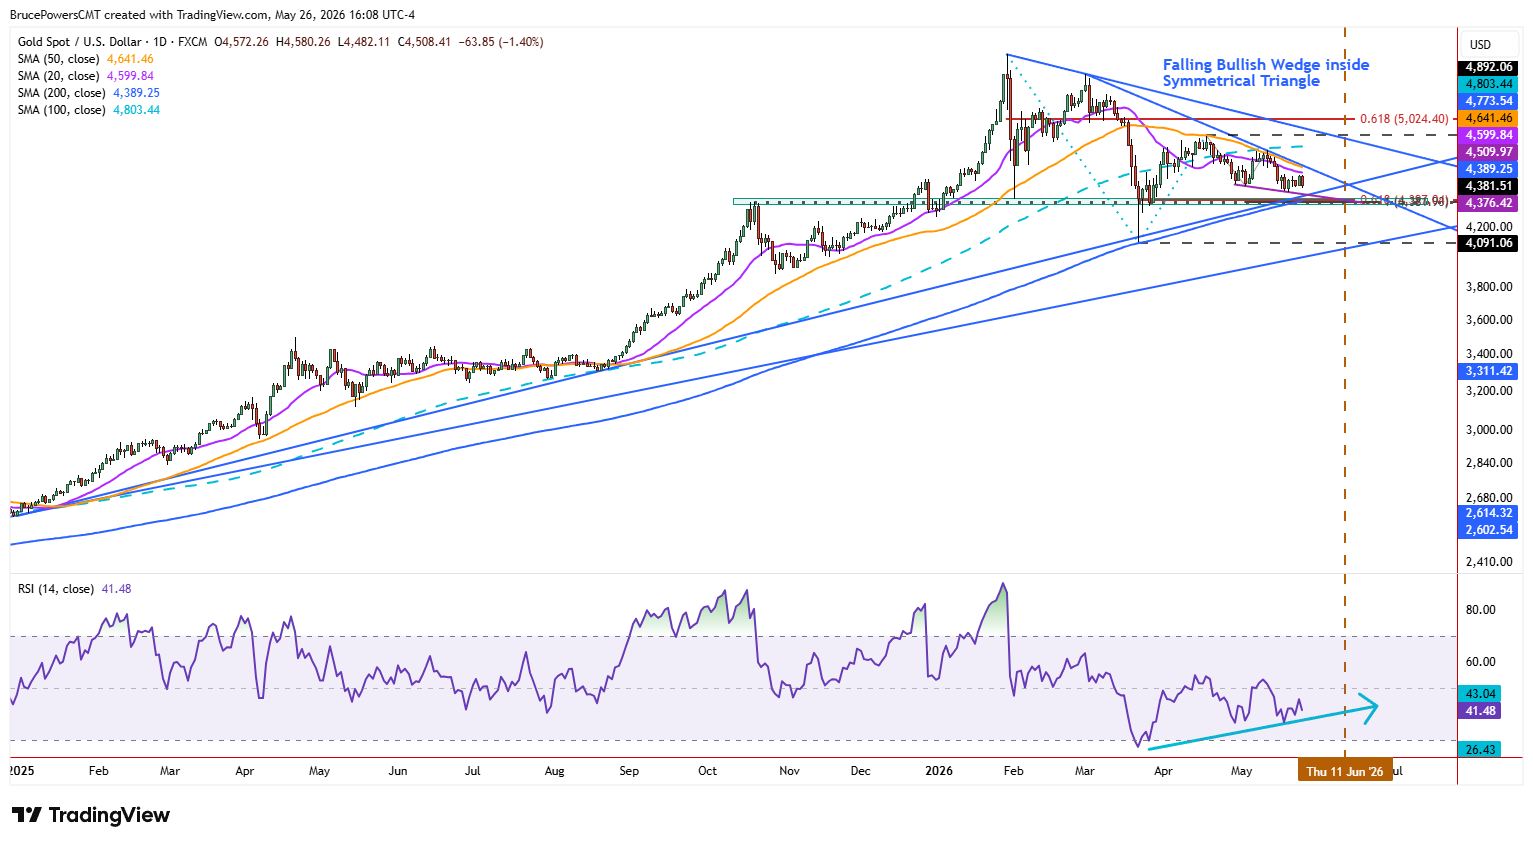
An uptrend and downtrend line that intersect around June 11 help define the parameters of a symmetrical triangle structure. As gold continues to trade inside that pattern, the potential range declines unless one of the trendlines is broken. Further compression of price increases the probability of a spike in momentum upon a breakout. The second pattern to be aware of is a bullish falling wedge. For clarity, the lower boundary line of the wedge is purple. Although the symmetrical triangle pattern doesn’t suggest direction, the falling wedge does carry a directional bias to the upside.
Dynamic Resistance Cluster Builds Pressure
The downtrend line is key dynamic resistance and a decisive breakout above it will trigger a breakout of both the wedge and triangle patterns. Since the 50-day moving average is close to aligning with the trendline, it can be used as a proxy and is currently near $4,641 and falling. Since it was successfully tested twice during recent upswings, it represents key dynamic resistance.
Breakout Targets and Upside Projection
Upon a confirmed upside breakout, the first upside target zone is between $4,774 and $4,803, consisting of a lower swing high and the 100-day moving average, respectively. But given the two-pattern breakout that would signal, bullish momentum should be strong enough to exceed that price zone on the way to a lower swing high at $4,891.
Support Structure in Case of Breakdown
Further weakness could result in an eventual test of support near the 200-day moving average, now around $4,389. It is validated by several other indicators of support. However, the intersection of the lower wedge line with the uptrend line near $4,430 marks it as a potentially significant near-term support zone at a higher level. After that, the uptrend line marks potential support at consecutively higher price levels. Overall, this compression phase reinforces the broader theme established at the beginning of the analysis, where tightening price action beneath key resistance suggests an impending expansion of volatility once a breakout direction is resolved.
Gold Price Forecast
Every new Gold analysis as it publishes, today's technical signal and key levels, live price — on one page.
See all Gold forecastsIf you’d like to know more about how to trade gold and silver, please visit our educational area.


