Oil Spike Drives Gold Sellers, Not Buyers
Spot gold is selling off for a third straight session. XAU/USD dropped to $4,052.40, down $53.72, or 1.31%, at 11:07 GMT Wednesday after President Trump declared the Iran deal “over” and crude oil ran past $74 a barrel. Gold should be catching a bid on that kind of escalation. Instead it’s getting sold. That tells you the inflation and rate trade is running this market, not the geopolitical risk.
The sell-off accelerated as Treasury yields climbed, the dollar hit a weekly high, and September rate hike odds moved higher. The Fed minutes from the June 16-17 meeting land this afternoon and the setup going in is hostile for gold on every side.

Crude Above $74 Keeps the Fed Cornered
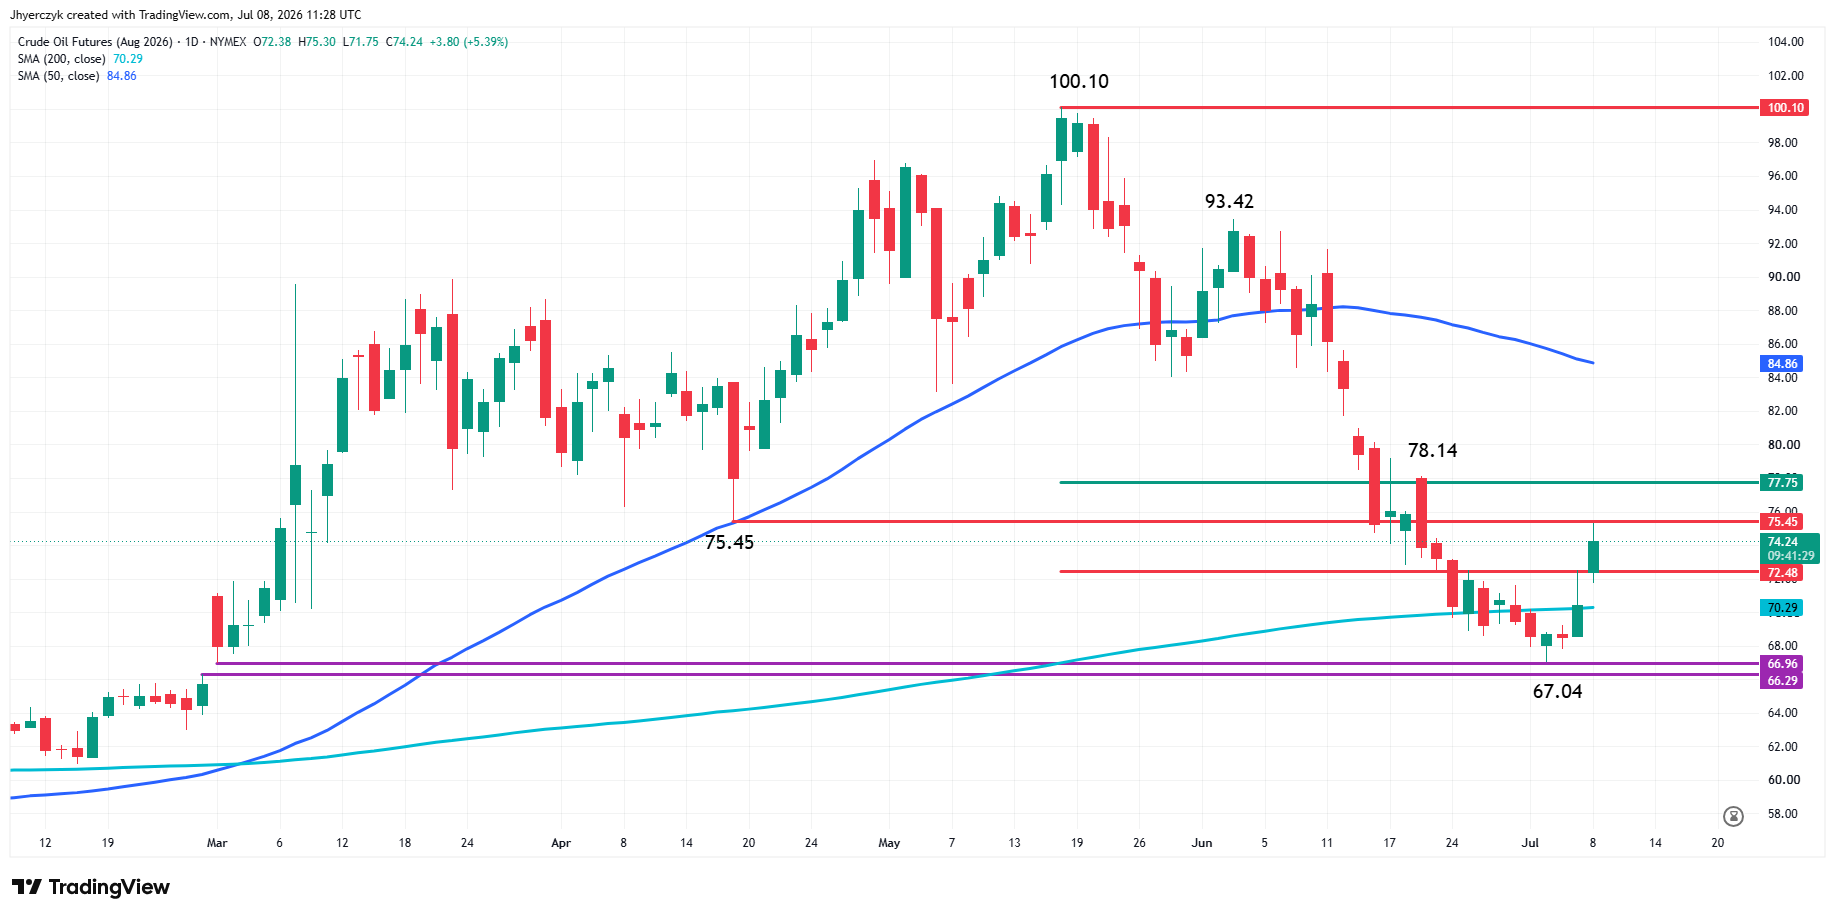
WTI crude jumped 6.45% to $74.93. Brent rose 6.18% to $78.73. The rally came after Trump said the agreement with Iran was finished and that he had no interest in engaging with Tehran. CENTCOM launched strikes following attacks on three commercial vessels in the Strait of Hormuz. Iran’s Revolutionary Guards said they targeted U.S. military positions in Bahrain and Kuwait. Treasury revoked the export license that had kept Iranian barrels flowing.
Gold traders already know what $75 crude does to the rate conversation when inflation is running double the Fed’s target. An energy shock at this level does not create safe-haven demand for gold. It gives the Fed another reason to stay aggressive. If crude keeps pressing toward $80, the inflation read gets worse and the rate path gets harder. That is not a gold buying setup.
September Hike Odds Hit 68% Before the Minutes
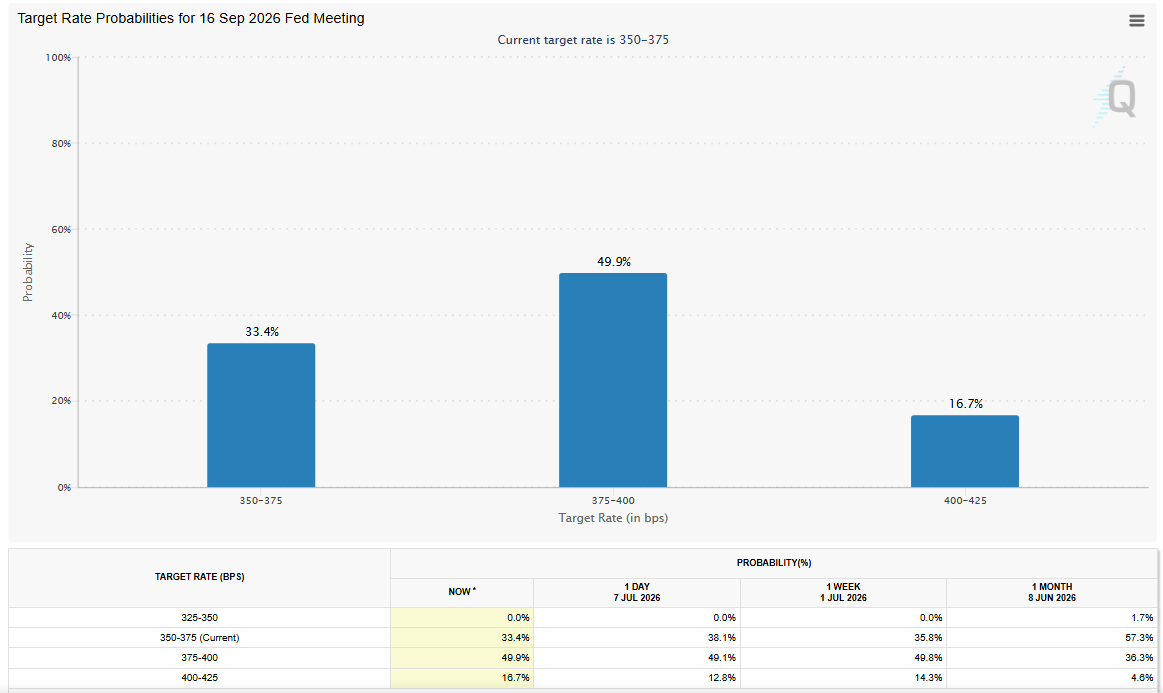
September hike odds climbed to 68% on Tuesday, up from 62% the day before, and that was before crude blew through $74. The FedWatch repricing is doing real damage to gold because every percentage point higher in that number strengthens yields and the dollar at the same time.
Gold Price Forecast
Every new Gold analysis as it publishes, today's technical signal and key levels, live price — on one page.
See all Gold forecastsThe June 16-17 meeting held at 3.50% to 3.75% but the dot plot showed a committee leaning toward at least one more hike. Warsh gave almost nothing at the press conference. No forward guidance. No signal on July. “The FOMC minutes will be a wildcard simply because Warsh was so opaque at the most recent press conference,” Vital Knowledge founder Adam Crisafulli said.
That opacity is the risk for gold this afternoon. If the minutes are short and hawkish, traders fill the silence with worst-case assumptions. The Fed does not need to announce anything. It just needs to not push back against the pricing that is already crushing the bid in XAU/USD.
Yields and Dollar Are Squeezing Gold From Both Sides
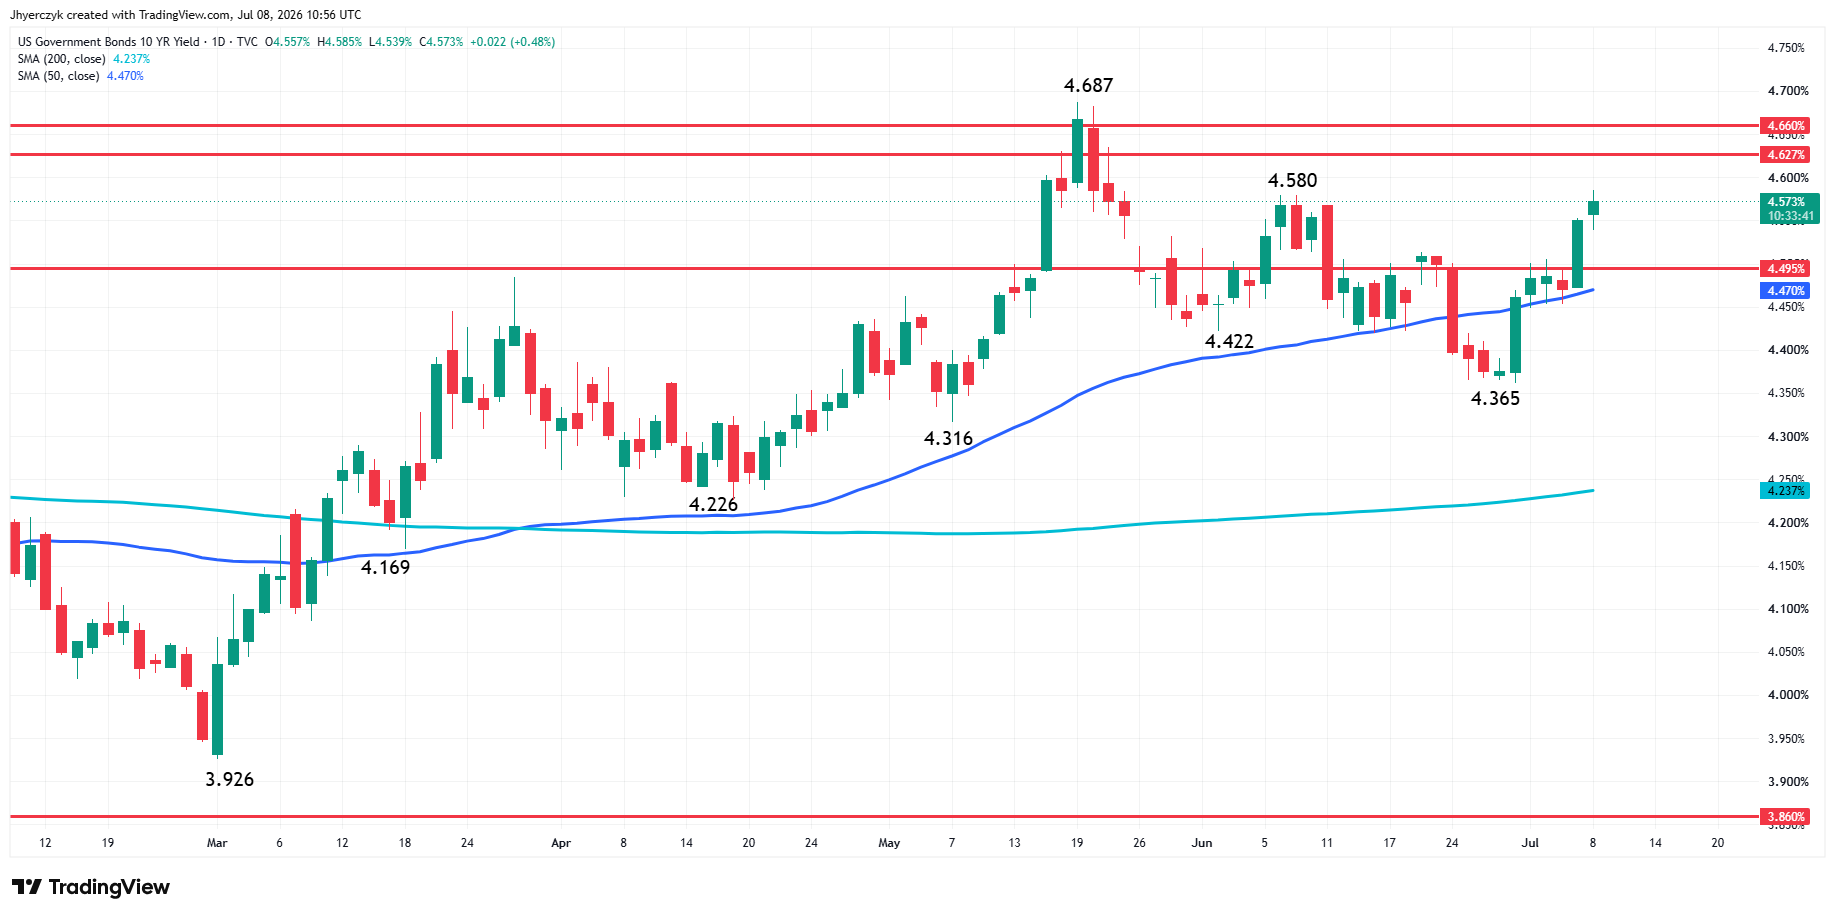
The 10-year Treasury yield climbed more than 5 basis points to 4.5812%. The 2-year added more than 5 basis points to 4.2182%. The 30-year pushed above 5% to 5.0752%. Those moves are confirming the same message the oil market is sending. Traders are repricing the inflation outlook and the rate path at the same time.
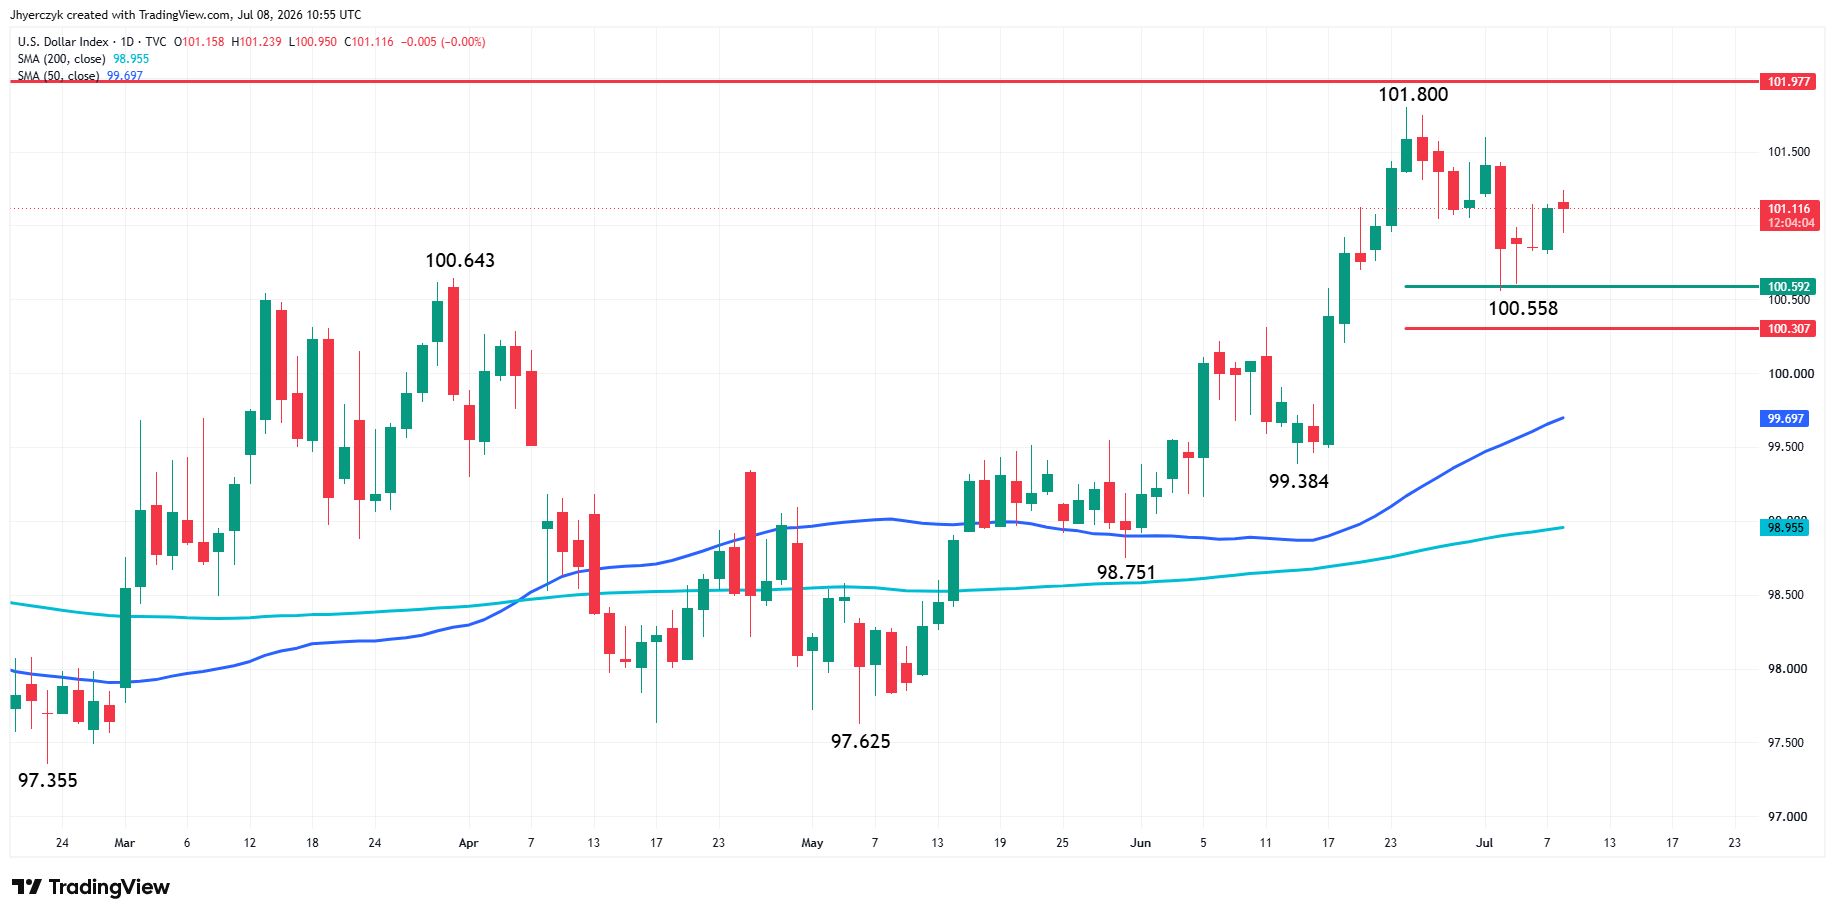
The dollar index hit 101.18 Wednesday, its highest level since July 2. Money rotated into the greenback after the strikes and the energy rally. Gold is getting squeezed from both directions. Yields are rising and the dollar is reinforcing the same pressure. Until one of those reverses, rallies are going to attract sellers looking to fade the geopolitical bid that is not there.
The 30-year holding above 5% is worth watching separately. That keeps attention on long-term inflation expectations and borrowing costs, and it tells you the bond market is not convinced inflation is coming down anytime soon.
Daily Spot Gold (XAU/USD) Technical Analysis
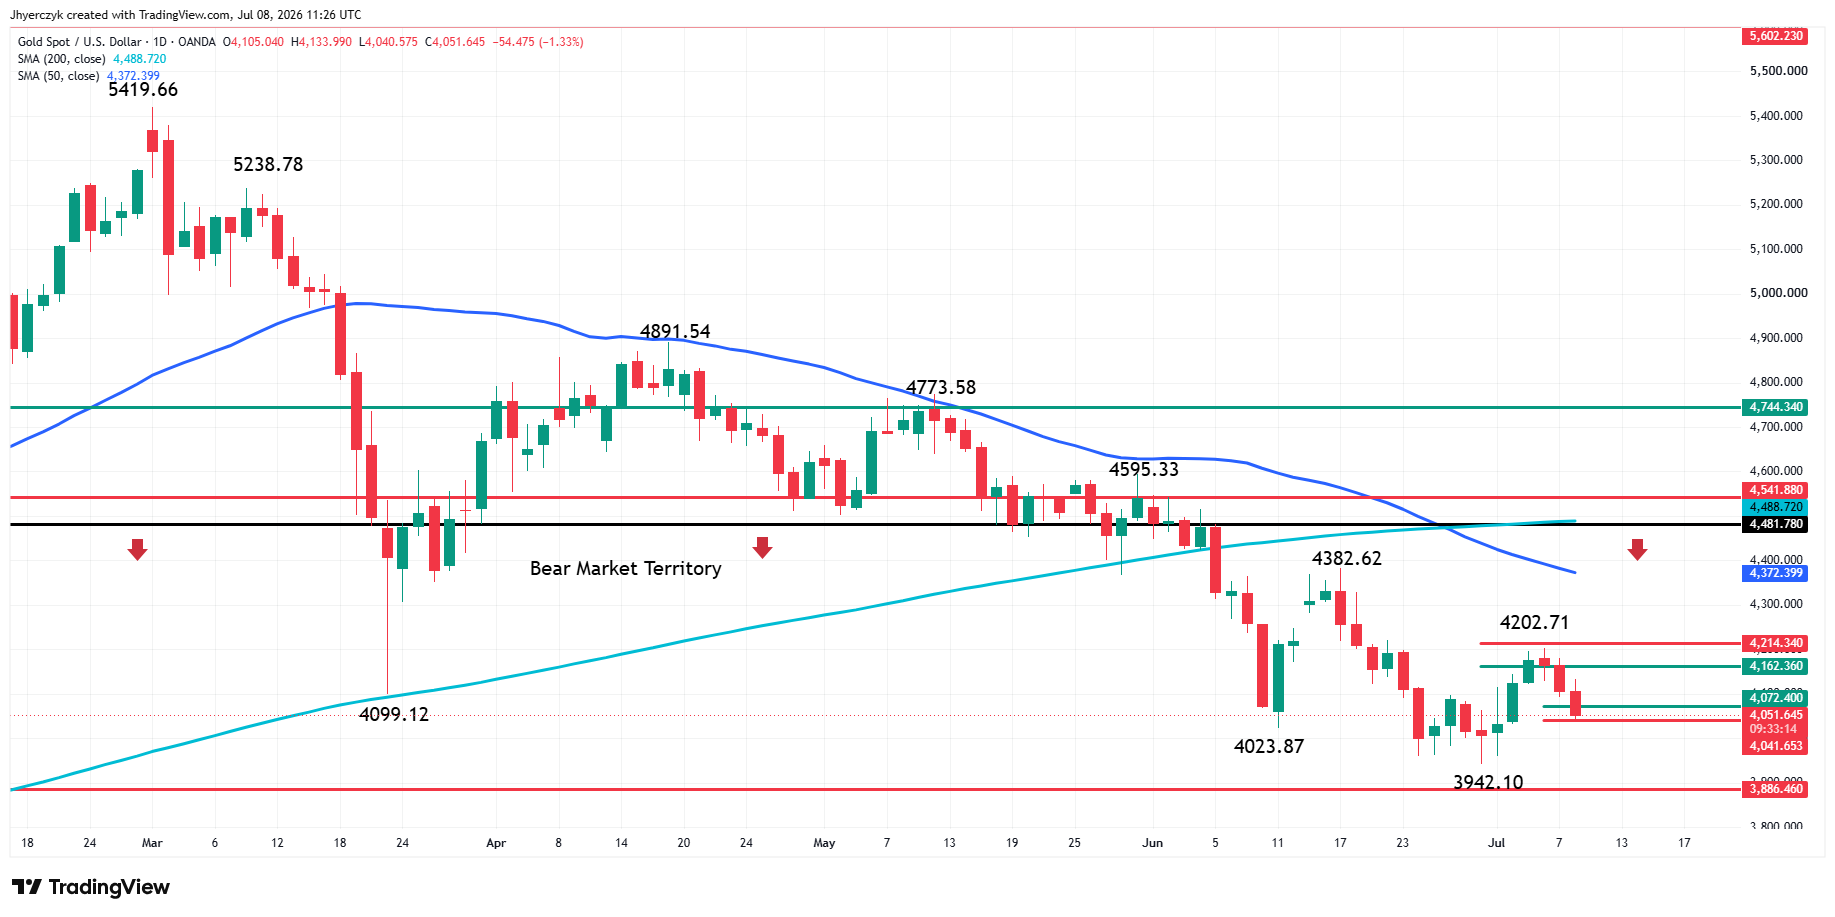
Spot gold is down after being rejected by a short-term retracement zone on Monday. A new swing top was formed, creating a short-term range of $3942.10 to $4202.71.
The retracement zone that stopped the rally at $4202.71 is $4162.36 to $4214.34. This is resistance. The retracement zone that is being tested is $4072.40 to $4041.65, potential support.
Although the trend is down and the market is in the midst of a three-day sell-off, we still have to respect the short-term retracement zone at $4072.40 to $4041.65. This is because aggressive counter-trend buyers could step in to stop the price slide.
If enough buyers do show up inside this retracement zone, a secondary higher bottom could form and prices could turn quickly, setting up the possibility of a retest of $4162.36 to $4214.34. Overcoming this area will change the trend to up and all of a sudden, the 50-day moving average at $4372.44 will hit the radar.
If buyers turn out to be scarce and sellers continue to dominate then look for $4041.65 to fail and the market to possibly plunge into the main bottom at $3942.10. This is the last potential support before the next bearish trigger point at $3886.46.
Essentially what I’m saying is, trader reaction to $4072.40 to $4041.65 will set the tone on Wednesday. A new secondary higher bottom could begin to form on a sustained move over $4072.40, or the sell-off could resume with conviction under $4041.65.
While this is our short-term view, longer-term buyers may find value at $3942.10 to $3886.46, but that’s it. If $3886.46 fails, another down leg could begin. As far as a long-term rally is concerned, the market has to clear two retracement zones and a pair of moving averages before I’ll declare the selling over.
Our choices are to passively bid in the value zone, or aggressively take out offers, hoping for a breakout to the upside. If buyers come in on the lows, but disappear before the breakout, we could be in for a long-term sideways trade.
What to Watch
Four forces are working against gold at the same time and none of them are reversing. Crude above $74 keeps inflation expectations elevated. Treasury yields are climbing across the curve. The dollar is at a weekly high. September hike odds jumped to 68% before the minutes even dropped. If the minutes read hawkish, that number goes higher and gold loses another layer of support.
Gold is sitting right on top of the $4,072.40 to $4,041.65 retracement zone. A hold there builds a secondary higher bottom and the short-term picture changes. But four headwinds hitting at once makes that a hard floor to defend. If it breaks, $3,942.10 is the main bottom and $3,886.46 is where the next leg down accelerates.
If you’d like to know more about how to trade gold, please visit our educational area.