The higher inflation, oil volatility and mixed growth signals force investors to rethink the path of Federal Reserve policy. The real GDP shows slow growth and the real disposable personal income weakness suggests pressures on consumers. PCE inflation continues to be above the Fed’s 2% target and higher oil volatility could worsen the inflation issue. This puts the Fed in a difficult position as rate cuts support growth but premature cuts could lead to a repeat of an inflationary wave. This article discusses the U.S. interest rate outlook, the impact of inflation and oil prices on Fed policy and the key market signals from U.S. Treasury yields, the U.S. dollar and major U.S. stock indices.

Slower U.S. Growth Complicates the Fed Interest Rate Outlook
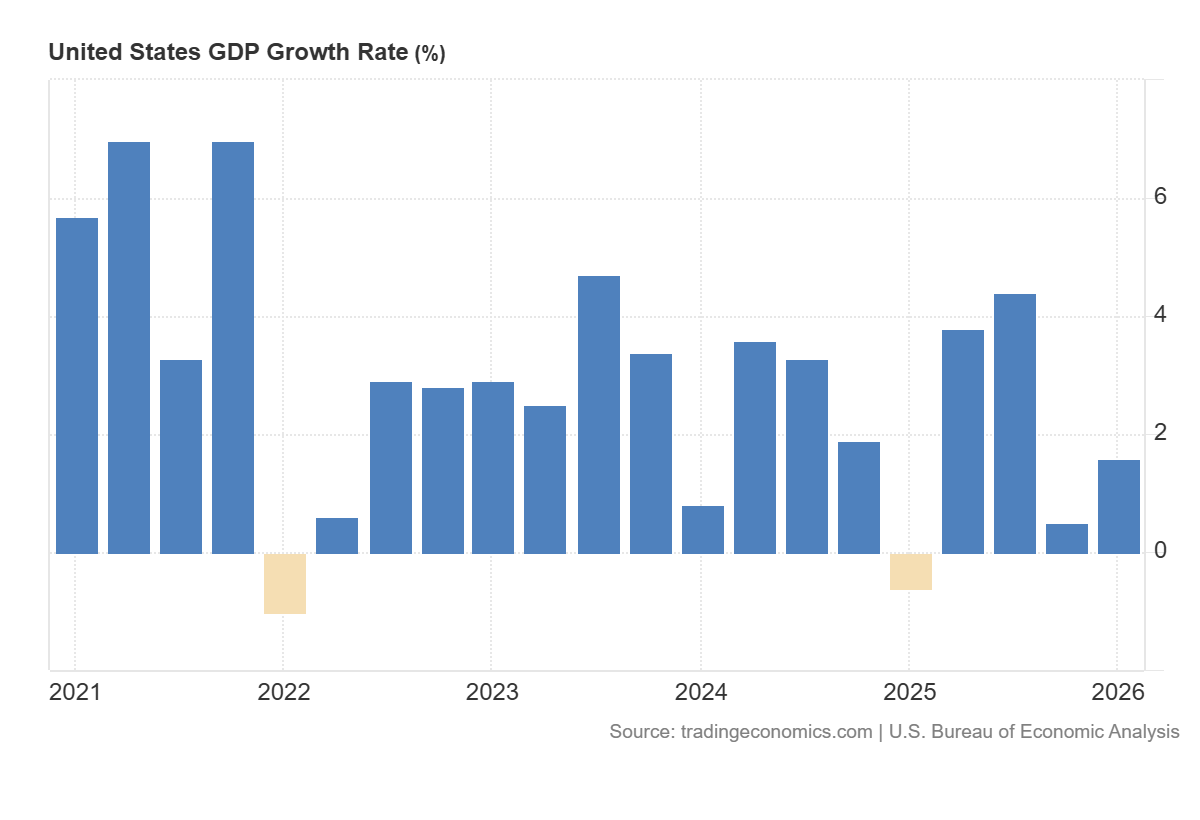
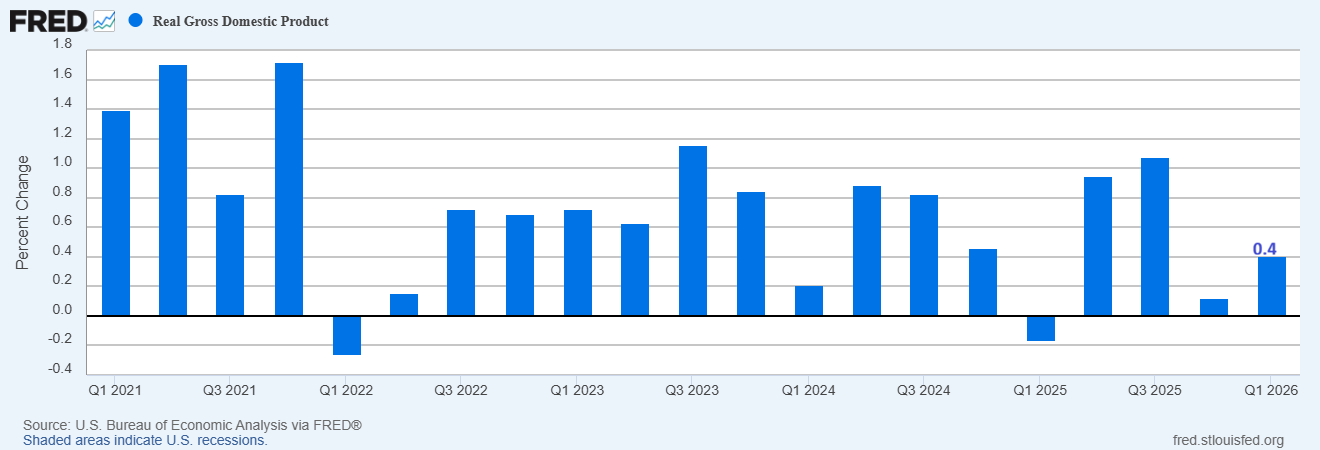
The first problem for the Fed is the growth. The headline GDP figure is already showing slower momentum as shown in the chart below.
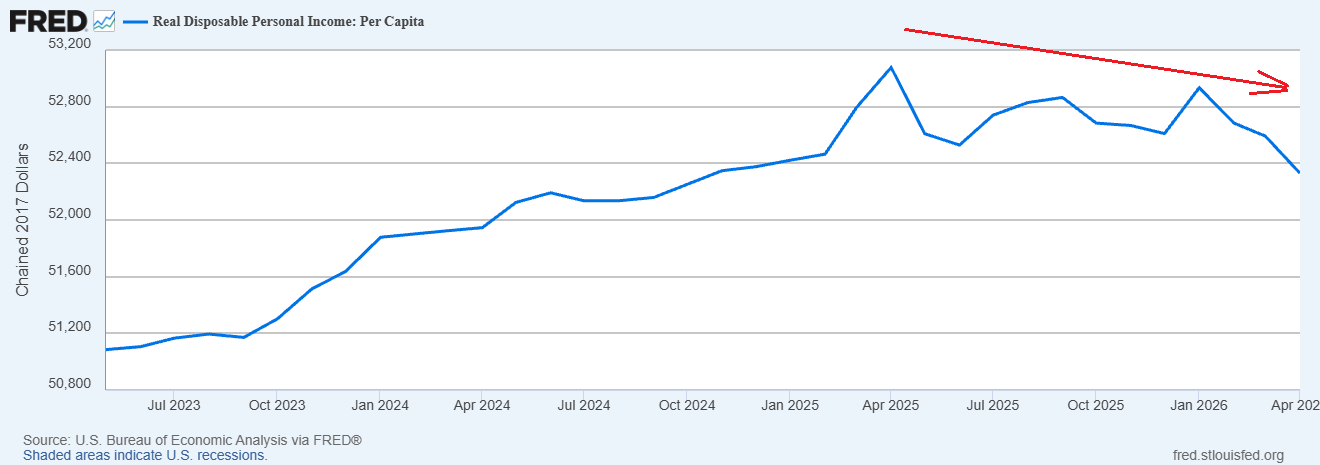
But the more important issue is the fall in real disposable personal income.
The consumer behavior also looks weak. The chart below shows that the personal saving rate remains in negative trend and shows a potential reliance by households on their savings or borrowing for spending. This does not suggest a long term foundation for growth.
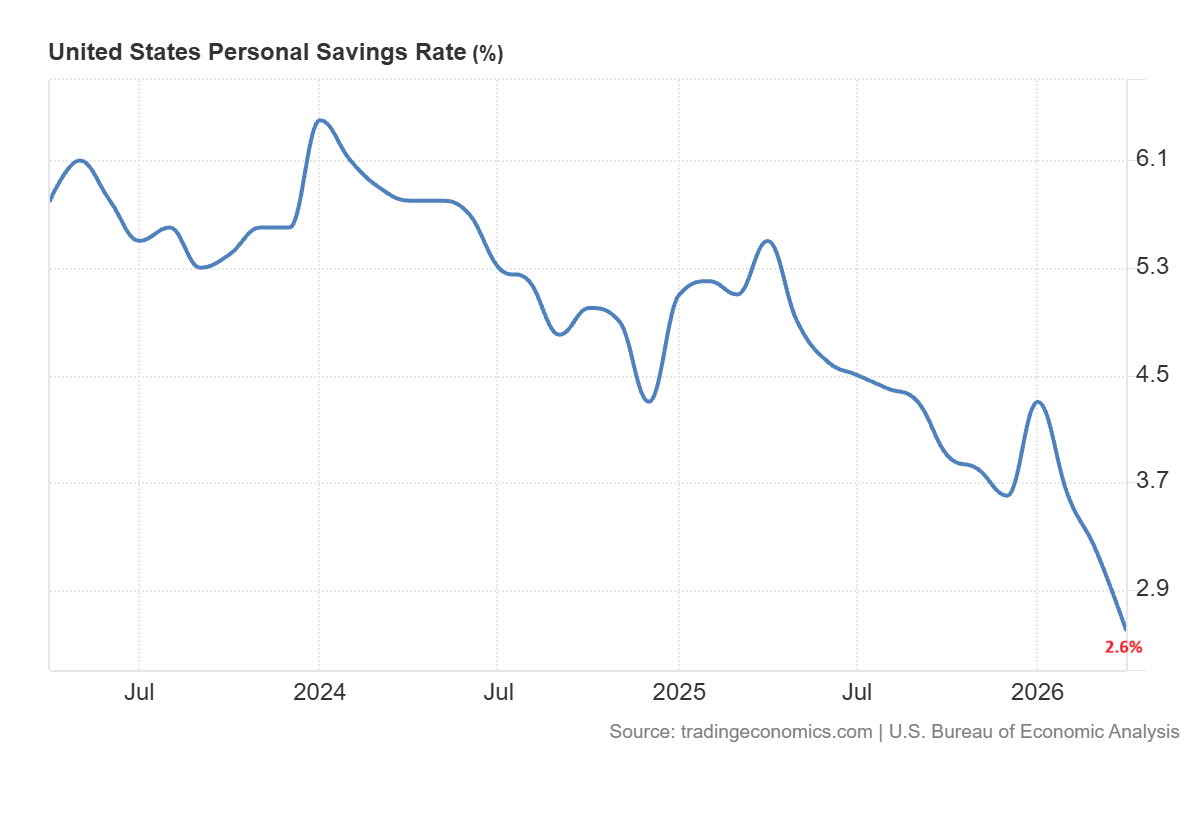
This is important for interest rates as Fed can not only focus on inflation. It should also track growth and employment. If the growth is slow, the rate hikes become difficult. But a rise in inflation makes rate cuts challenging. That is the reason the interest rate outlook is mixed but remains cautious.
Dow Jones Price Forecast
Every new Dow Jones analysis as it publishes, today's technical signal and key levels, live price — on one page.
See all Dow Jones forecastsSticky Inflation Delay Fed Rate Cut Expectations
Inflation remains the key driver of the interest rate outlook after the US-Iran war. The PCE inflation increased to 3.8% for the 12 months to April. This is higher than the Fed’s 2% objective.
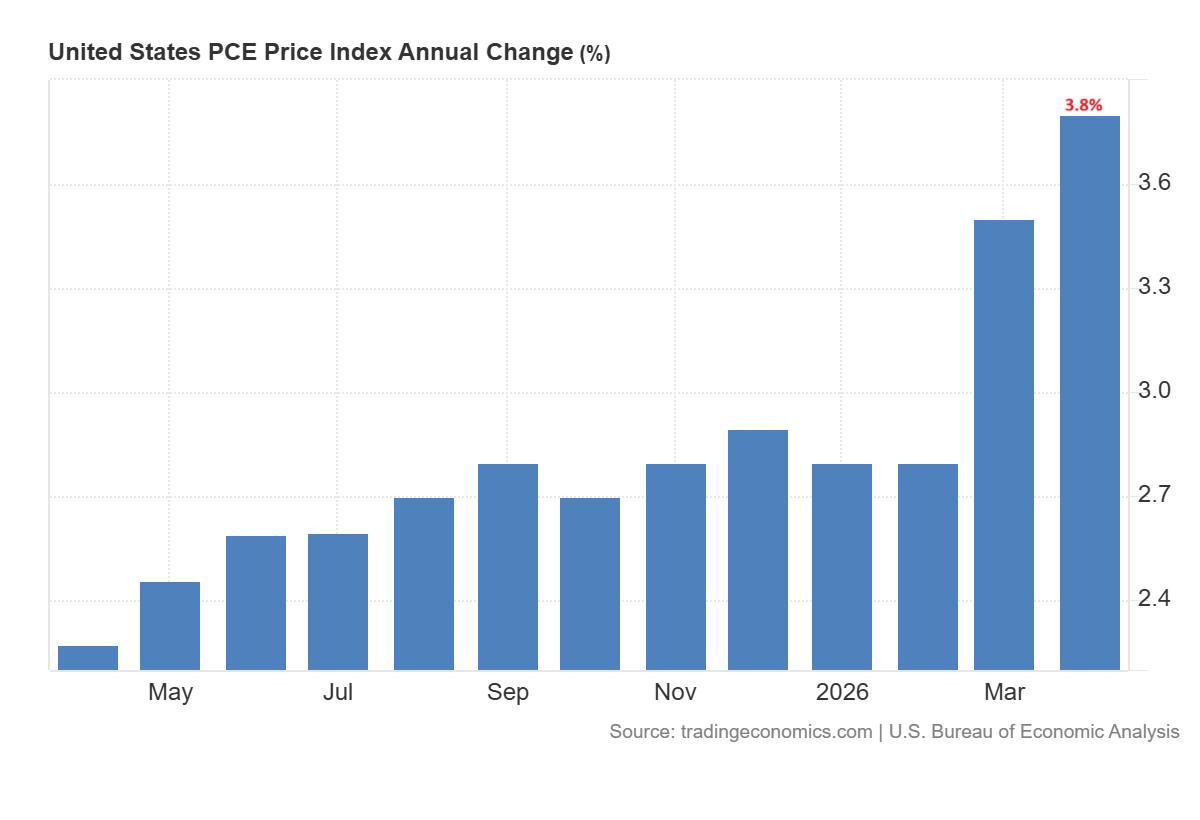
The 0.40% rise for the month also indicates that inflationary pressures remain.
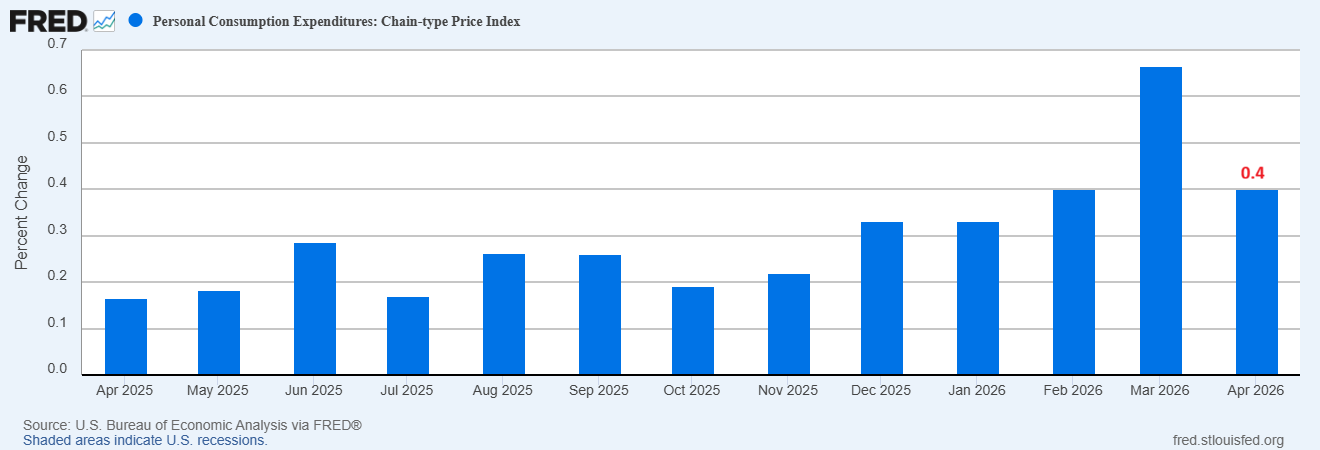
The oil shock makes the situation more difficult. The surge in fuel costs first affects the headline inflation. Core inflation may respond with a lag as transport and energy prices are passed on to services and goods. That’s important because if businesses begin to pass on the oil shock across the economy, the Fed may find it harder to view the shock as temporary.
Fed officials show that the oil prices remain the main concern for the interest rates. San Francisco Fed President Mary Daly mentioned that if oil prices continue to rise it will change the inflation picture. Kansas City Fed President Jeffrey Schmid also noted that inflation is too hot. He mentioned that the inflation remains high for long time. These remarks suggest that the Fed will have to maintain the tight policy stance if oil prices continue to push the inflation higher.
This means that the Fed might not be ready to cut rates easily. But the market now has to weigh the prospects of keeping interest rates elevated for extended period. If the oil prices remain above $100 and inflation starts spreading across the economy, the risk of a rate hike will grow.
10-Year Treasury Yield Signals Higher-for-Longer Fed Policy Risk
The U.S. Treasury yield is a barometer of the inflation, growth and Fed policy expectations. Yields tend to increase when investors believe that inflation will be higher or that the Fed will be tightening its policy.
With this configuration, the 10-year Treasury yield has strong correlation with crude oil prices. The US-Iran war further strengthened this correlation as the closure of the Strait of Hormuz disrupted global energy supply. The chart below shows a recent drop in oil prices from the peak of 19 May, which is pushing the US Treasury yields and the US dollar downward.
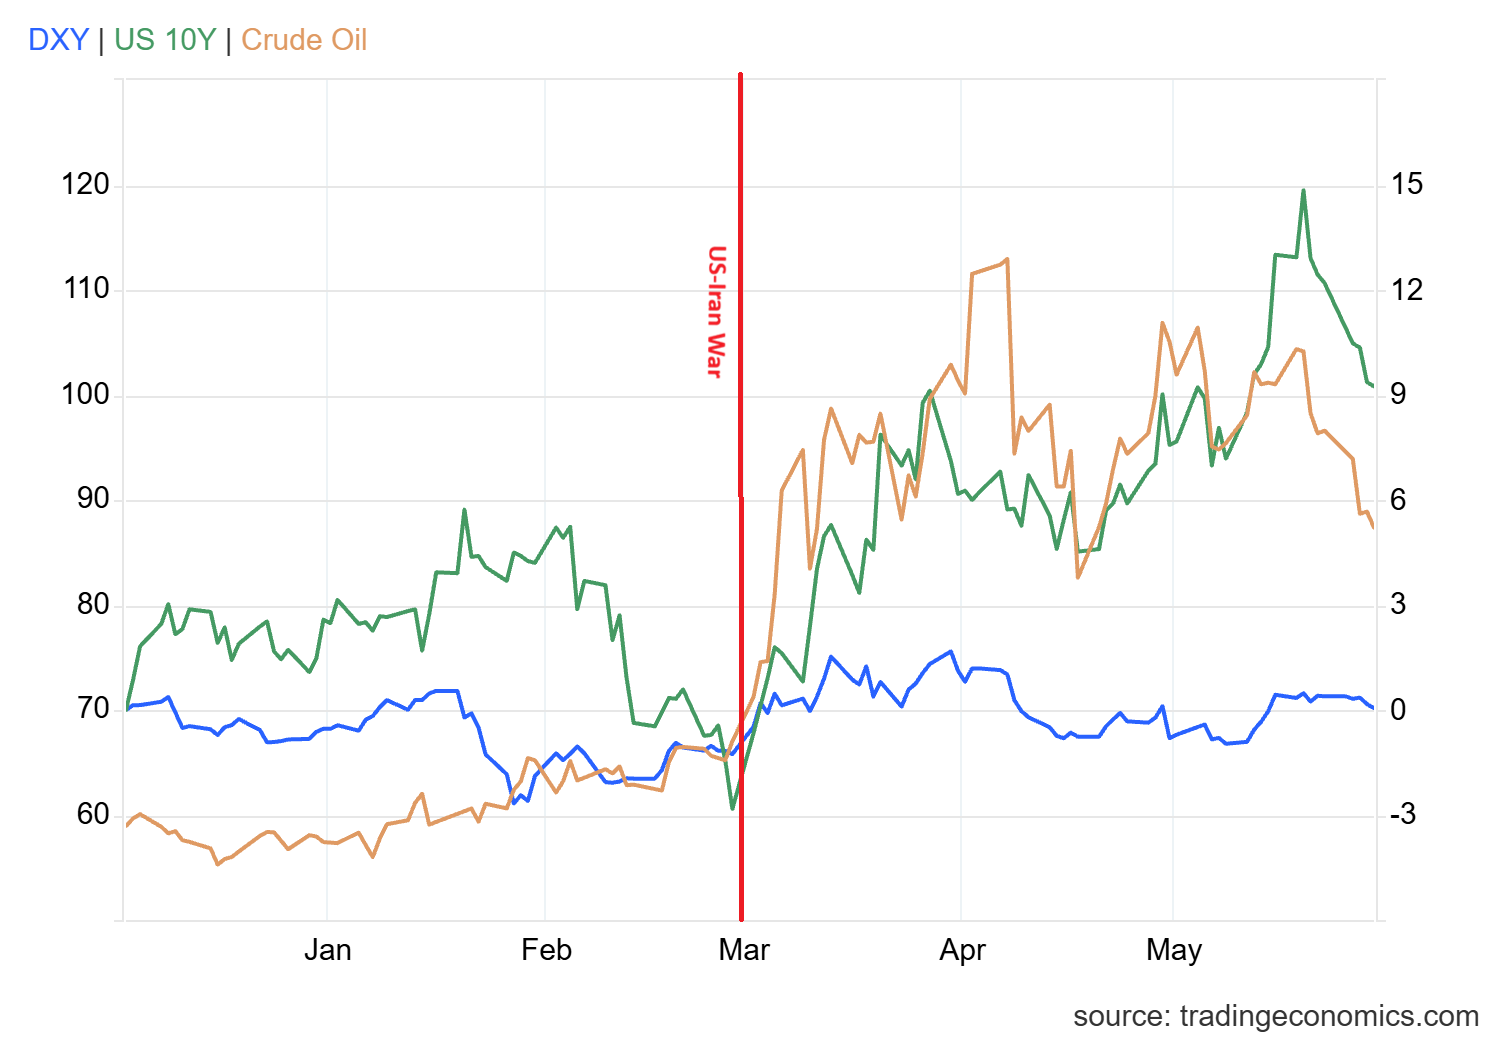
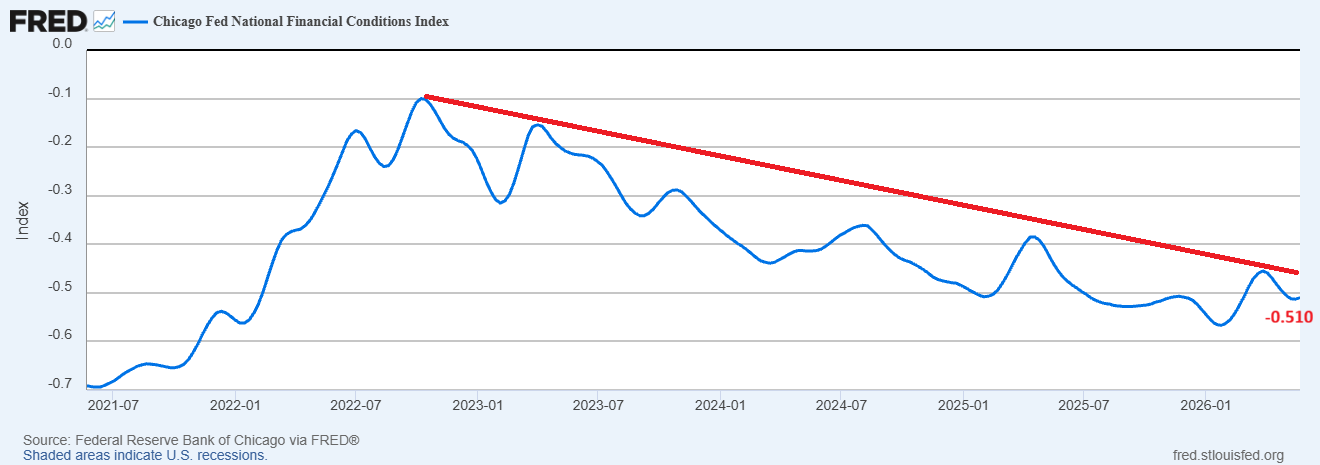
The increase in the US Treasury yields can tighten the financial conditions even before the Fed changes the interest rates. But the Chicago Fed Nasional Financial Conditions Index signals easy financial consolidation. This means that higher yields are creating pressure but they have not yet tightened the broader financial system.
US Treasury yields drive up the borrowing costs for businesses, individuals and governments. They also squeeze rate sensitive assets. Hence, the 10-year yield is the leading indicator during this environment that aligns with the Fed interest rate outlook, US dollar and currency pairs.
U.S. Dollar Index Strengthens as Fed Rate Cut Bets Fade
The second large instrument is the U.S. Dollar Index. A dollar rally typically takes place when the Fed is optimistic about the economy. The demand for the dollar could improve if the inflation in the U.S. does not drop and the Fed does not cut rates.
If investors move to safety in times of market stress, the dollar could also benefit. There are a number of risks in the current configuration. Inflation is rising. Oil prices are tied to the Iran war. Bitcoin (BTC) is already down below 80,000 which indicates reduced risk appetite. If investors cut back on their risk investments, these forces can support the US dollar.
But the direction for the US dollar remains uncertain. The dollar may lose steam if growth slows dramatically and the market begins to price in future Fed rate cuts. The inflation story provides a more solid short-term foundation for the dollar for now.
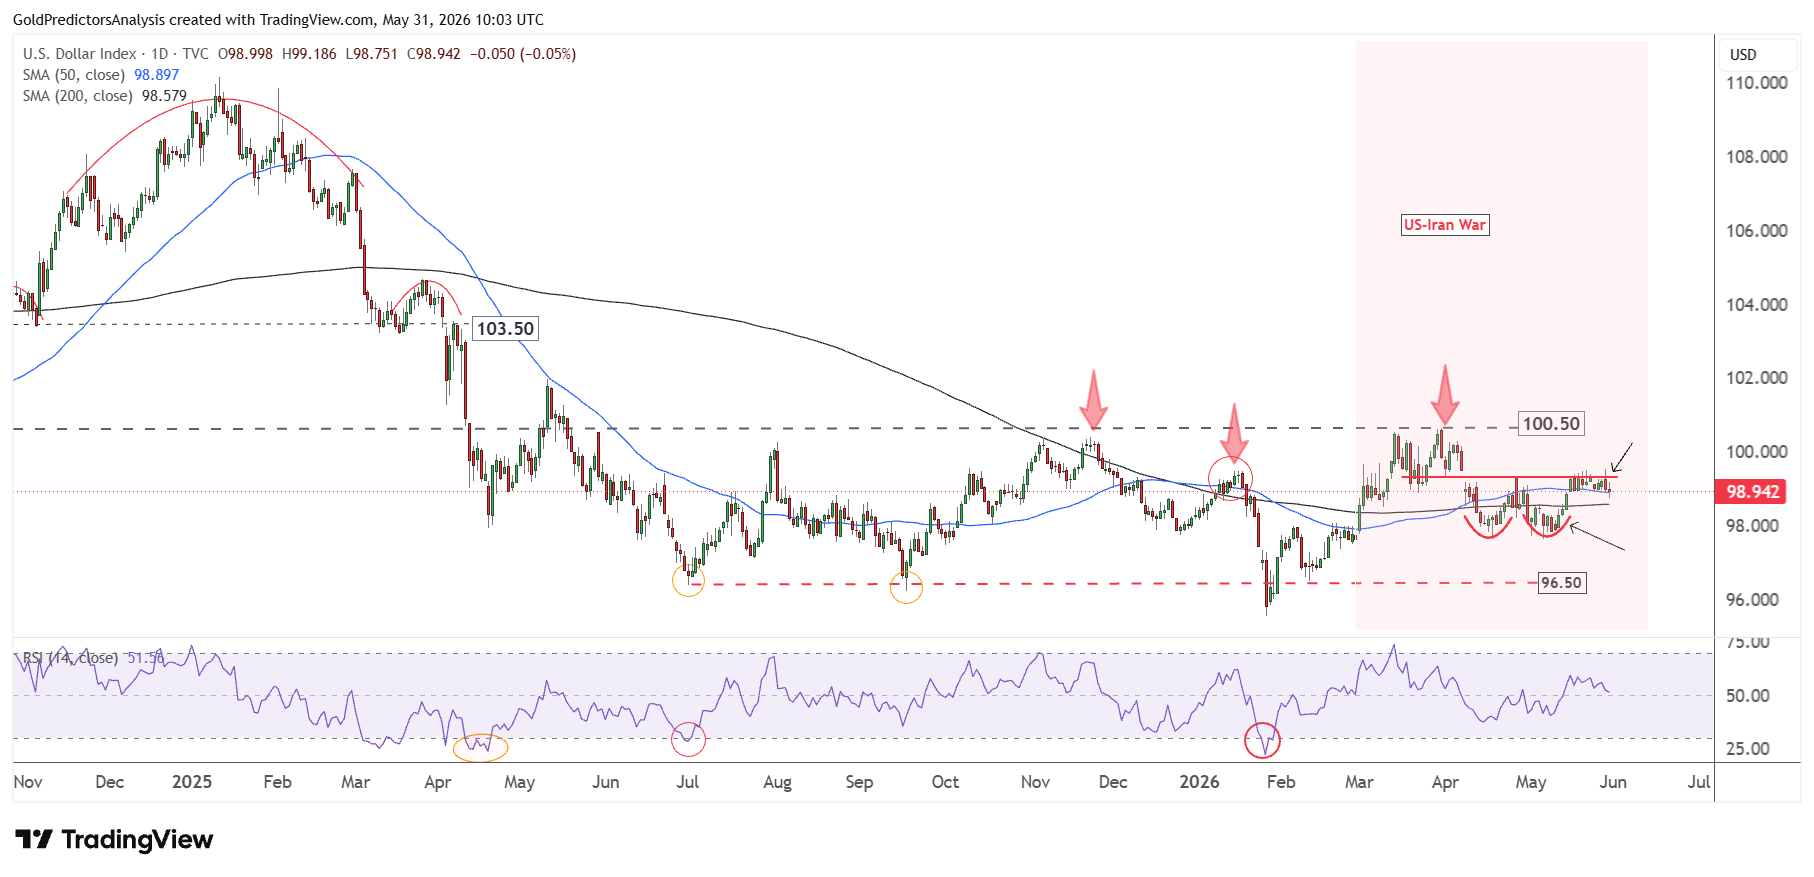
The chart below shows that the US dollar formed a bearish hammer candle at 99.40 after the PCE inflation data. But the index still remains above the moving averages. A break above 99.40 will push the index to 100.50. On the other hand, a break below 98 will push the index to the 90 level.
S&P 500 Rally Faces Interest Rate Risk as Treasury Yields Rise
The S&P 500 ended above 7,500 for the first time and keeps the next target of 8,000. The AI boom continues to support the rally and technology and megacap stocks have rallied on solid profit expectations.
The interest rate expectations also impact the rally in S&P 500. Investors may see lower equity prices as higher rates reduce the future earnings. They can also drive up the price of funds for companies and lower investor interest in high-priced growth stocks.
This next labour market report will be important. If payrolls are better than expected, investors could be concerned about an overheating economy. If the number of jobs is above 150,000, it will support the US Treasury yields. This scenario supports the possibility of higher interest rates and correction in the equity market from the record high. But a softer number could help quell some fears of rate hikes, while heightening concerns about slower growth.
This creates a narrow path for S&P 500. Stocks need enough growth to support earnings, but not so strong that the Fed shifts into hawkish mode.
From technical perspective, the S&P 500 has broken the 7,000 level after forming a V-shaped recovery pattern above the 6,200 support level. This breakout has opened the target of the 8,000 level, which is the resistance of the ascending broadening wedge pattern.
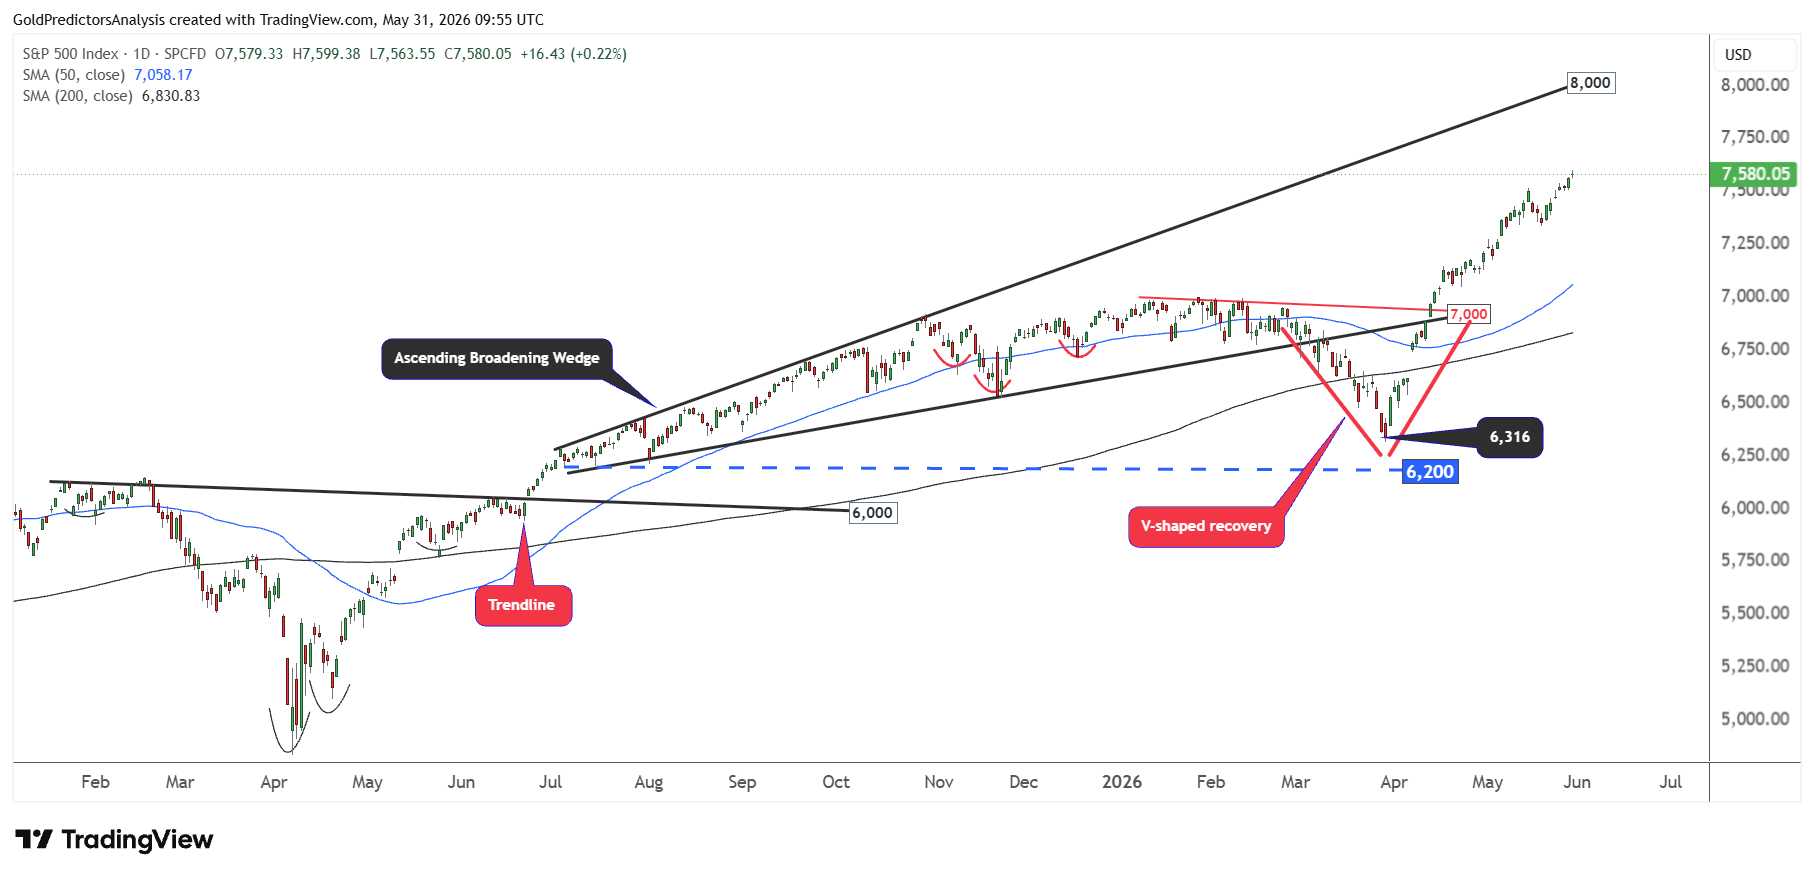
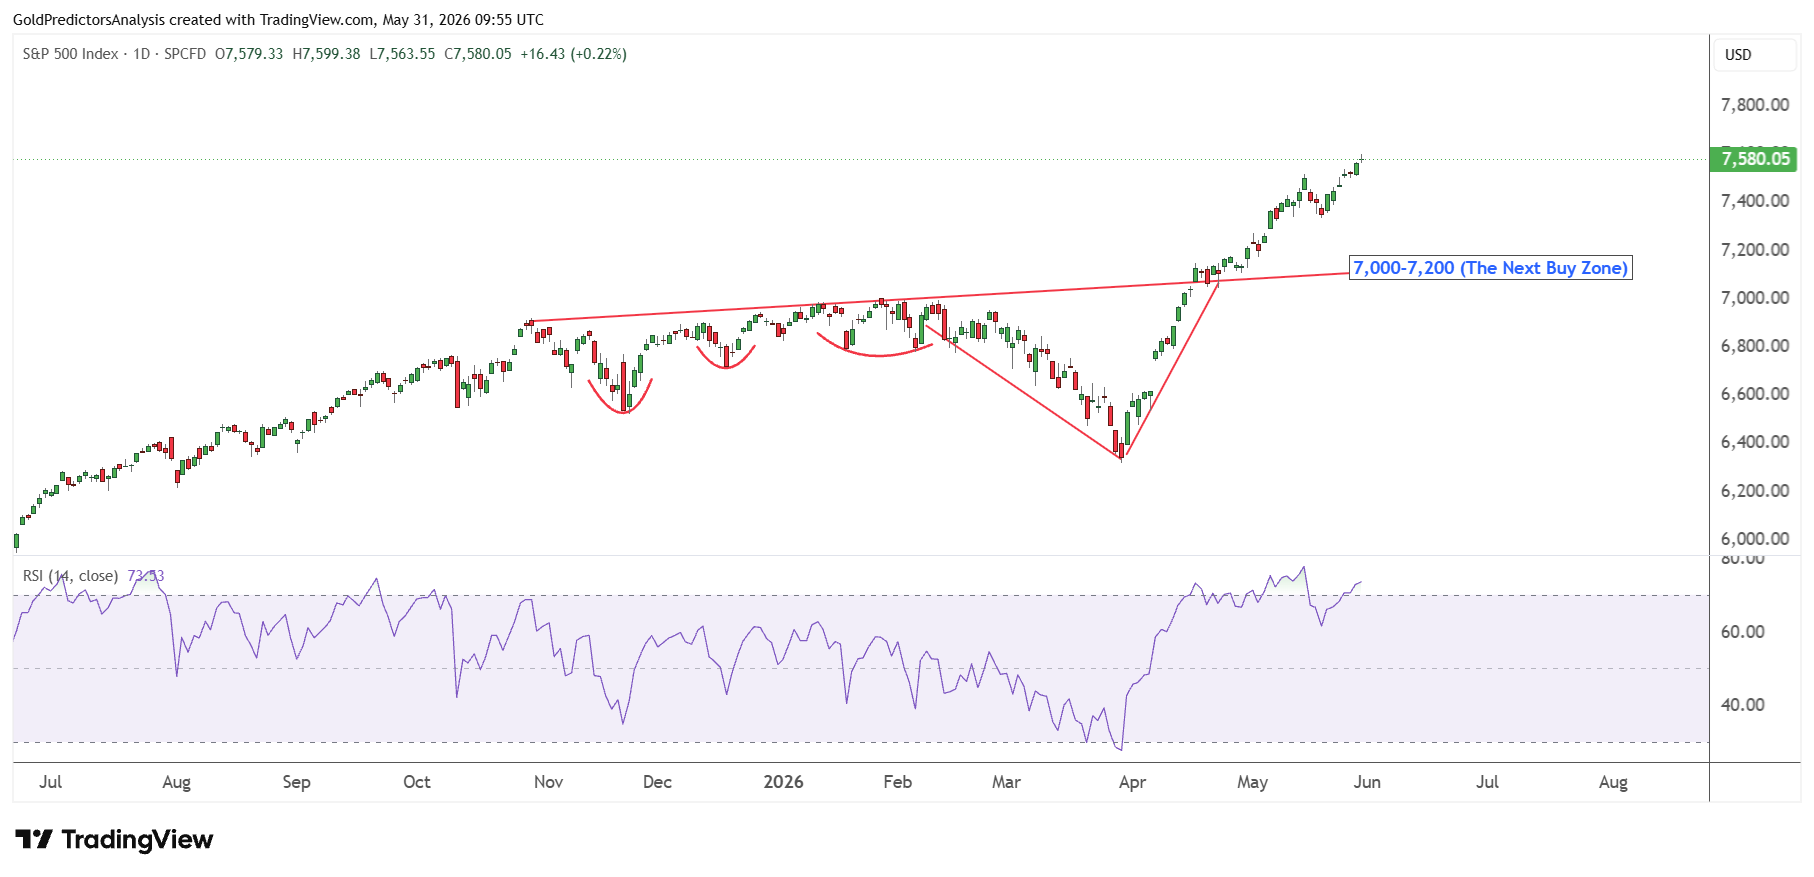
The 50-day SMA has remained above the 200-day SMA since the June 2025 crossover. This suggests that the primary trend in the S&P 500 remains upward. The target of 8,000 is further confirmed by the bullish price action on the daily chart, which shows that the 7,000 to 7,200 area remains the next buy opportunity for the U.S. stock market in the S&P 500. This correction may lead to another advance toward the 8,000 level.
Dow Jones and Nasdaq React Differently to Higher Interest Rates
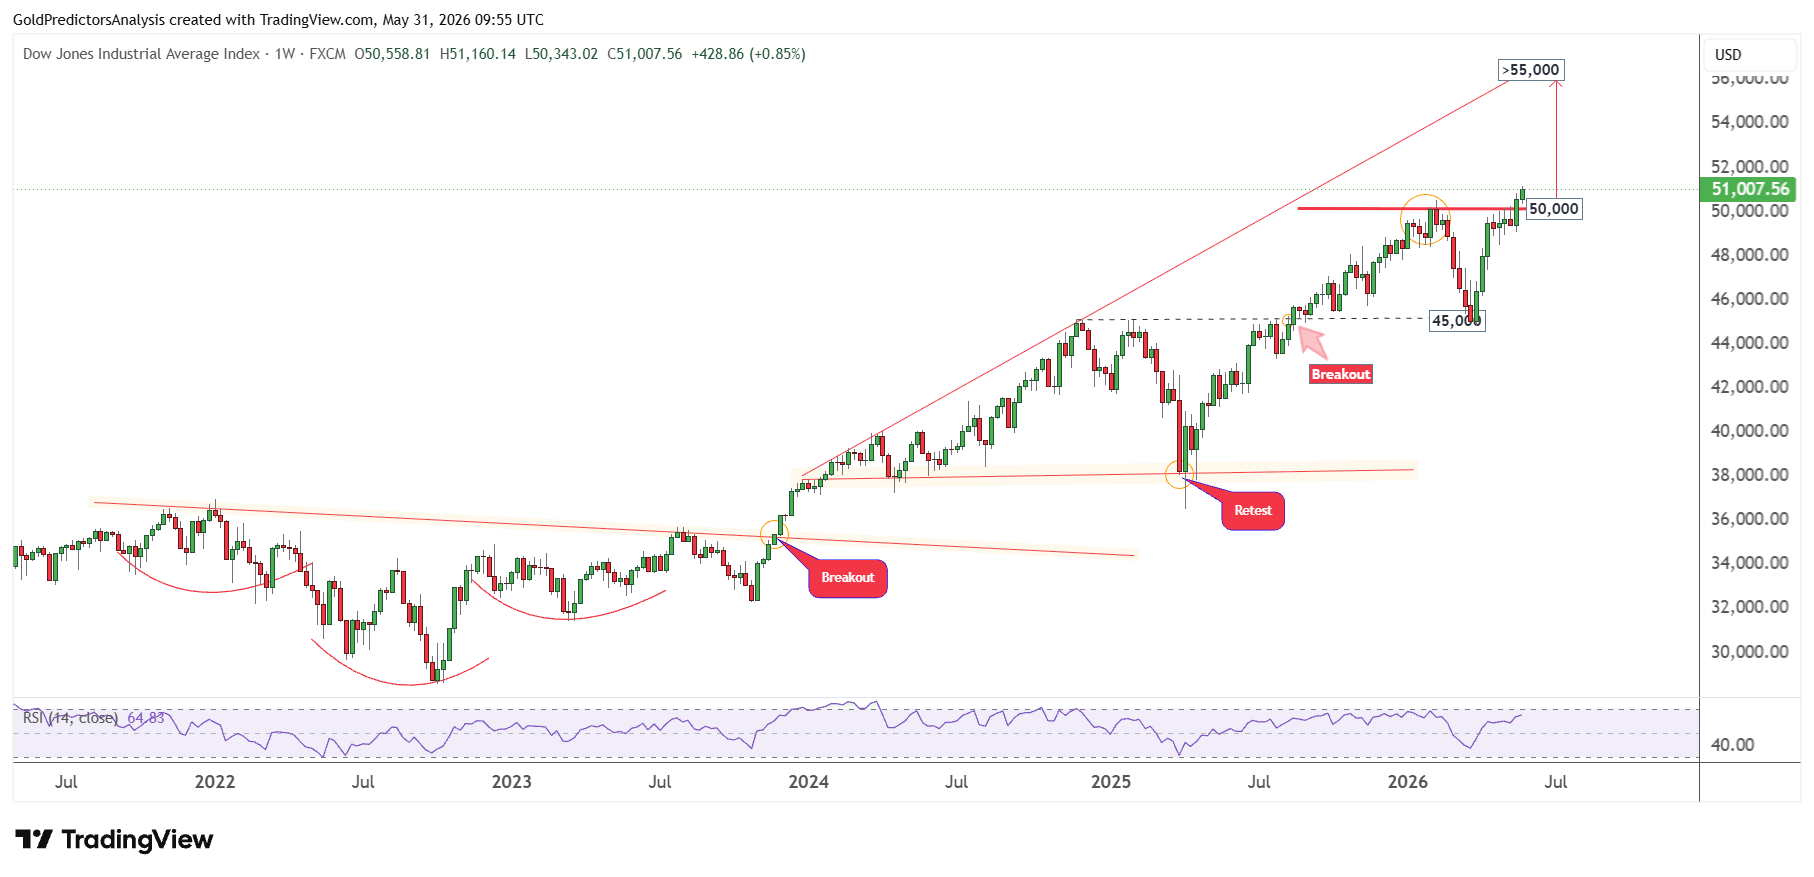
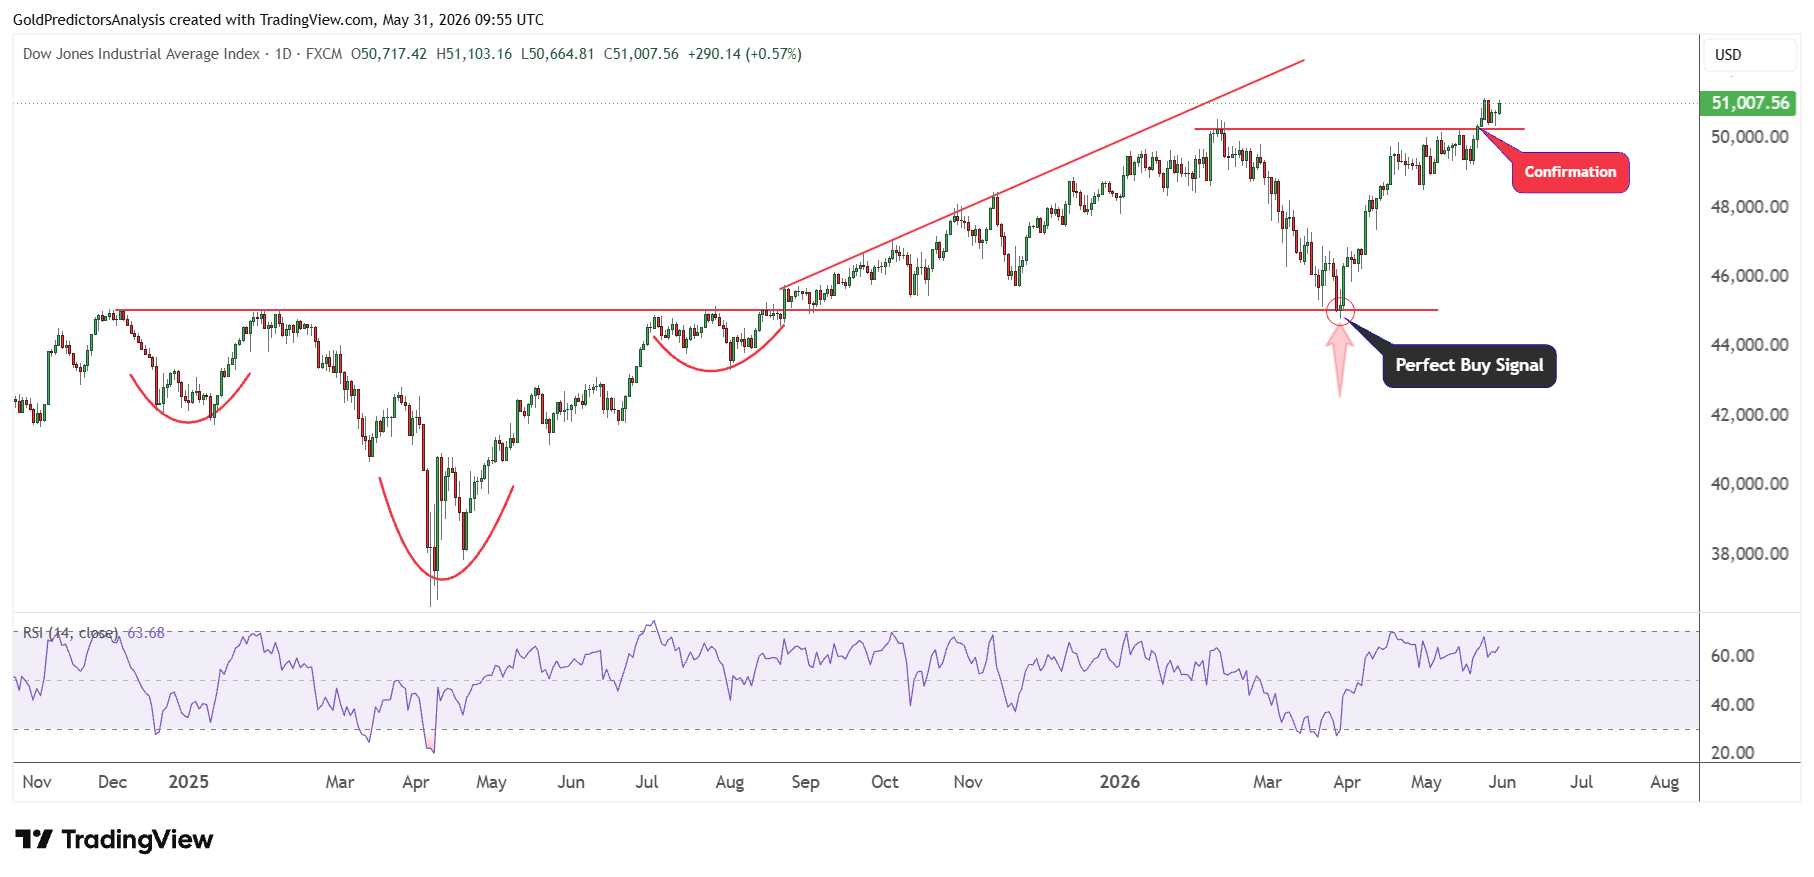
Dow Jones Industrial Average has broken the key 50,000 support level. If the index remains above the 50,000 level, it may rise to 55,000. But this target is subject to the oil price movements.
The Nasdaq is less sensitive to interest rates because it is more technology weighted. The index rose 16% on the bounce back of the AI trade. The move is supported by the solid results with strong earnings expectations. But an increase in Treasury yields could negatively affect the Nasdaq more than the Dow, as high growth stocks rely heavily on future earnings.
The long-term price structure for Dow Jones 30 remains constructive due to the formation of inverted head and shoulders patterns from 2021 to 2024. The breakout in the Dow Jones 30 from the 35,000 level has opened the door for a strong surge to record highs. The formation of ascending broadening wedge pattern after the breakout indicates that the next move in Dow Jones will likely be toward the 55,000 level.
It is interesting to note that the short-term price structure for Dow Jones shows the same picture. The correction toward the 45,000 level was a strong buy signal in Dow Jones 30 and the breakout above 50,000 is a major breakout that may take the index toward the 55,000 level in the near term.
In closing: Higher-for-Longer Fed Policy Remains the Base Case
The base case is that U.S. interest rates remain higher for longer after the US-Iran war. Inflation is out of control, oil prices are still a threat and Fed officials are not at ease declaring victory. If growth slows, the Fed is unlikely to raise rates, but it also has little room to cut rates as PCE inflation remains at 3.8%.
The 10-year Treasury yield is likely to be the most important indicator. If yields continue to rise, it may put pressure on stocks, particularly the Nasdaq and strengthen the U.S. dollar. The S&P 500 and Dow Jones would continue to rally in a stable yield environment. But with a new shock of rising oil prices, rate hike worries may return quickly.
Overall, the U.S. interest rate outlook now depends on one question: Will inflation slow down before growth declines? If inflation continues to be sticky, the Fed could continue to keep the lid on policy and let Treasury yields do the job. If growth slows sharply, rate cut expectations may resume. For now, the higher inflation risk keeps the markets under pressure of higher rates for longer, delaying the easing cycle.
Read more: Treasury Yield Surge Drives USDJPY, EURUSD and GBPUSD