Advertisement
Advertisement
July Brent Crude Building Momentum Over $111.64
By:
The direction of the July Brent crude oil market on Friday is likely to be determined by trader reaction to the Fibonacci level at $111.64.
Brent crude oil futures are edging higher for a third consecutive session on Friday as buyers continue to pound resistance, hoping to trigger a breakout to the upside.
Traders overtook a key resistance level on Thursday, but the move fizzled when buyers refused to chase the market higher. In retrospect, it looks like the rally was likely fueled by buy stops. In other to create a strong uptrend at current price levels, buyers are going to have to be willing to buy strength.
At 08:47 GMT, July Brent crude oil is trading $112.68, up $1.78 or +1.61%. On Thursday, the United States Oil Fund ETF (USO) settled at $80.45, up $0.23 or +0.29%.
OPEC+ Sticks to Modest Oil Output Hike Despite Price Rally
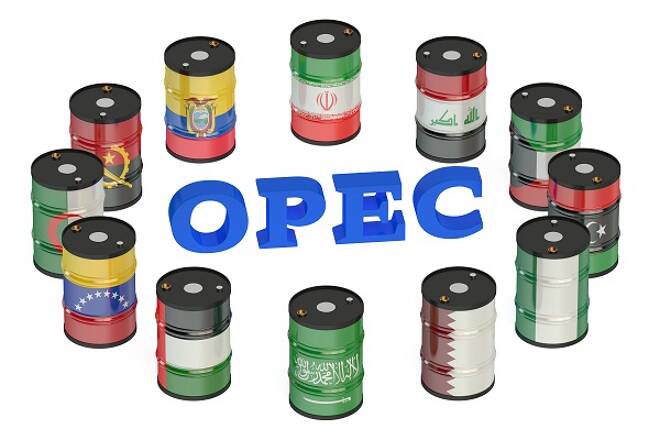
In fundamental news, OPEC+ agreed on Thursday to another modest monthly oil output increase, arguing that the producer group could not be blamed for disruptions to Russian supply and saying China’s coronavirus lockdowns threatened the outlook for demand, Reuters reported.
Ignoring calls from Western nations for accelerating output hikes, the group agreed to raise its June production target by 432,000 barrels per day, in line with an existing plan to unwind curbs made in 2020 when the COVID-19 pandemic hammered demand, according to Reuters.
Daily Swing Chart Technical Analysis
The main trend is up according to the daily swing chart. A trade through $113.99 will signal a resumption of the uptrend, while a move through the main top at $115.29 will reaffirm the uptrend. The main trend will change to down if $99.25 fails as support.
The market is up nine sessions from its last main bottom which puts it inside the window of time for a potentially damaging closing price reversal top.
The intermediate range is $123.25 to $92.87. The market is currently trading on the bullish side of its retracement zone at $111.64 to $108.06, making it support.
The short-term range is $92.87 to $115.29. Its retracement zone at $104.08 to $101.43 is the last support before the main bottom at $99.25.
Daily Swing Chart Technical Forecast
The direction of the July Brent crude oil market on Friday is likely to be determined by trader reaction to the Fibonacci level at $111.64.
Bullish Scenario
A sustained move over $111.64 will indicate the presence of buyers. If this generates enough upside momentum then look for a surge into $113.99, followed by the main top at $115.29. This is a potential trigger point for an acceleration to the upside with $123.25 the next major target.
Bearish Scenario
A sustained move under $111.64 will signal the presence of sellers. If this move creates enough downside momentum then look for a break into the 50% level at $108.06. Since the main trend is up, buyers could come in on a test of this level. If it fails, however, then look for the selling to possibly extend into the retracement zone at $104.08 to $101.43.
For a look at all of today’s economic events, check out our economic calendar.
About the Author
James Hyerczykauthor
James Hyerczyk is a U.S. based seasoned technical analyst and educator with over 40 years of experience in market analysis and trading, specializing in chart patterns and price movement. He is the author of two books on technical analysis and has a background in both futures and stock markets.
Advertisement
