


NASDAQ 100 Technical Analysis
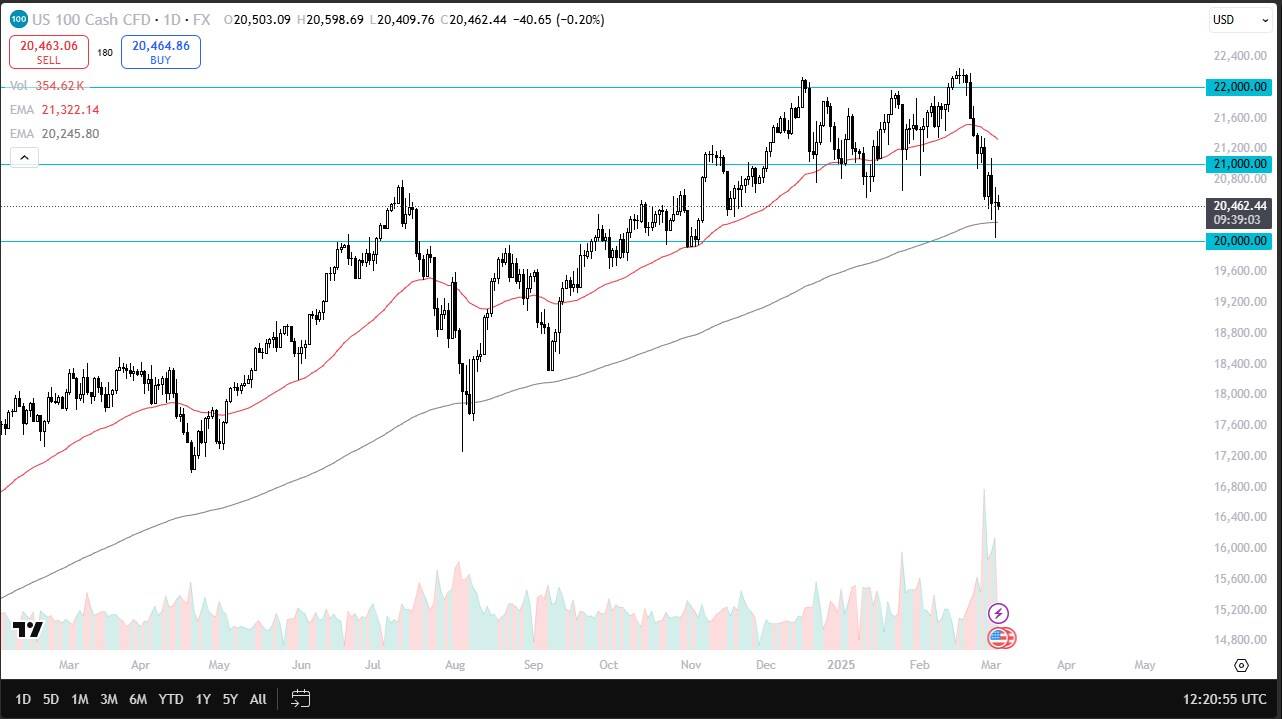
NASDAQ 100 initially did rally a bit during the trading session on Wednesday and then turned around to show a little bit of weakness before the market opens in New York. At this point, we are in the midst of hanging around a 200-day EMA indicator that a lot of people use to determine the trend.
The fact that we formed a hammer during the trading session on Tuesday is something I’m paying attention to, so if we can break above the top of it, I might be interested in re-entering. That being said, expect a lot of noise as people continue to try to price in the idea of a potential recession in the United States.
Dow Jones 30 Technical Analysis
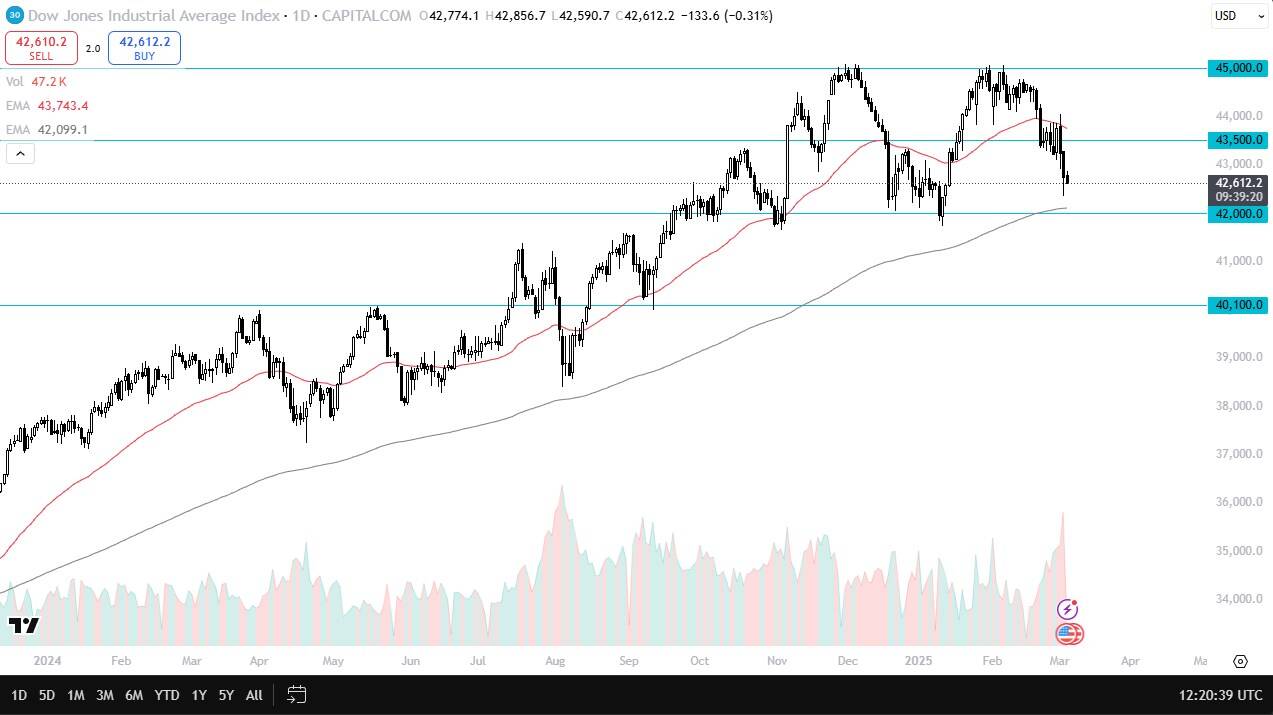
The Dow Jones Industrial Average has fallen just a bit during the day as well, and of course it’s about 600 points above the 200-day EMA. The 200-day EMA is right at the 42,000 level and is an area that I think a lot of people will be watching. If we turn around and break above the 43,500 level, then I think the Dow Jones 30 has a real shot at continuing the consolidation, which is essentially just working off some of the froth from the huge move higher.
S&P 500 Technical Analysis
The S&P 500 has pulled back to the 5,800 level, an area that of course is important, and during the previous session, we saw the S&P 500 fall and then bounce from the crucial 200-day EMA. It’ll be interesting to see if we can hang on to this, but as long as we can, then there is a chance that we re-enter the consolidation that we had been in.
If we rally from here and break above the highs of the candlestick from the session on Tuesday, then I think you have a real shot at the S&P 500 reaching the 6,000 level, where the 50 day EMA sits in. Obviously, there would be a lot of psychology attached to that big figure.
NASDAQ 100 Price Forecast
Every new NASDAQ 100 analysis as it publishes, today's technical signal and key levels, live price — on one page.
See all NASDAQ 100 forecastsFor a look at all of today’s economic events, check out our economic calendar.