NASDAQ 100 Technical Analysis
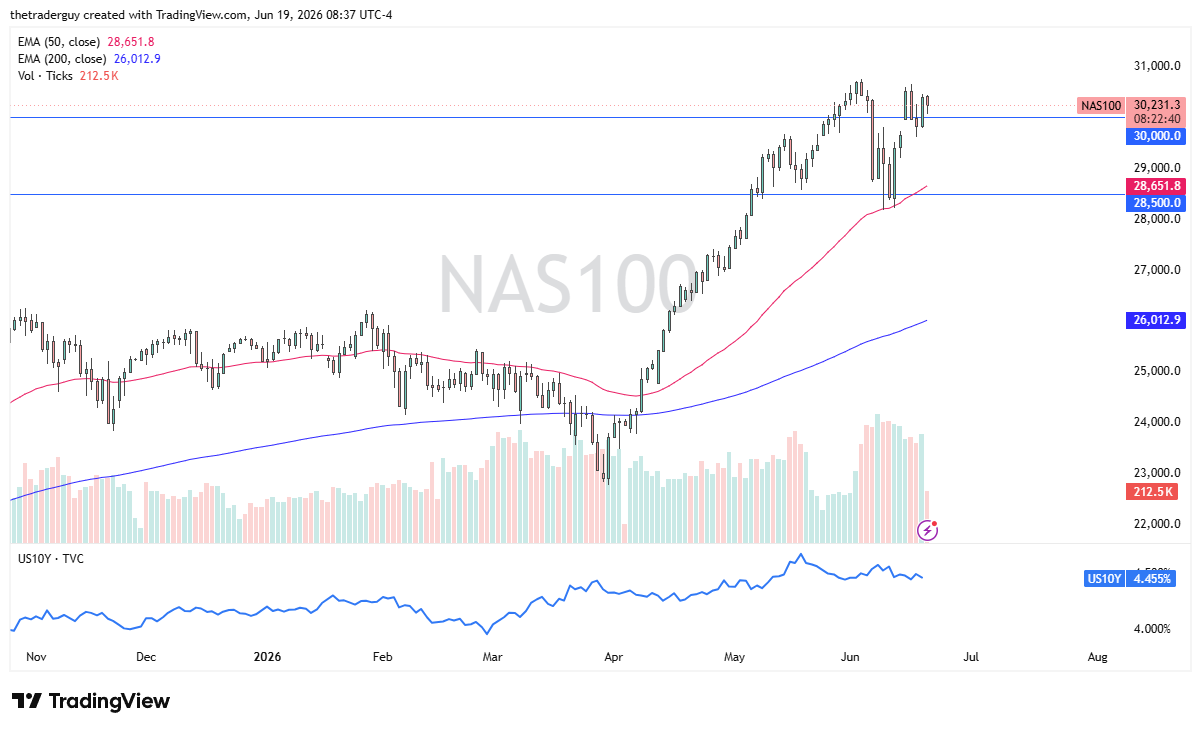
The US indices have pulled back just a bit during the early part of the session in premarket trading. Keep in mind that the actual underlying indices are closed; it’s Juneteenth in the United States. But the CFD markets showed a little bit of a pullback. This is a market that’s simply going to go sideways as we hang around 30,000, and that makes sense because we’re still trying to figure out the peace process.
Interest rates have dropped a little bit, and I think that gives a little bit of relief, but quite frankly, we’re just looking for a catalyst to break out to the upside. Short-term pullbacks continue to be buying opportunities.

Dow Jones 30 Technical Analysis
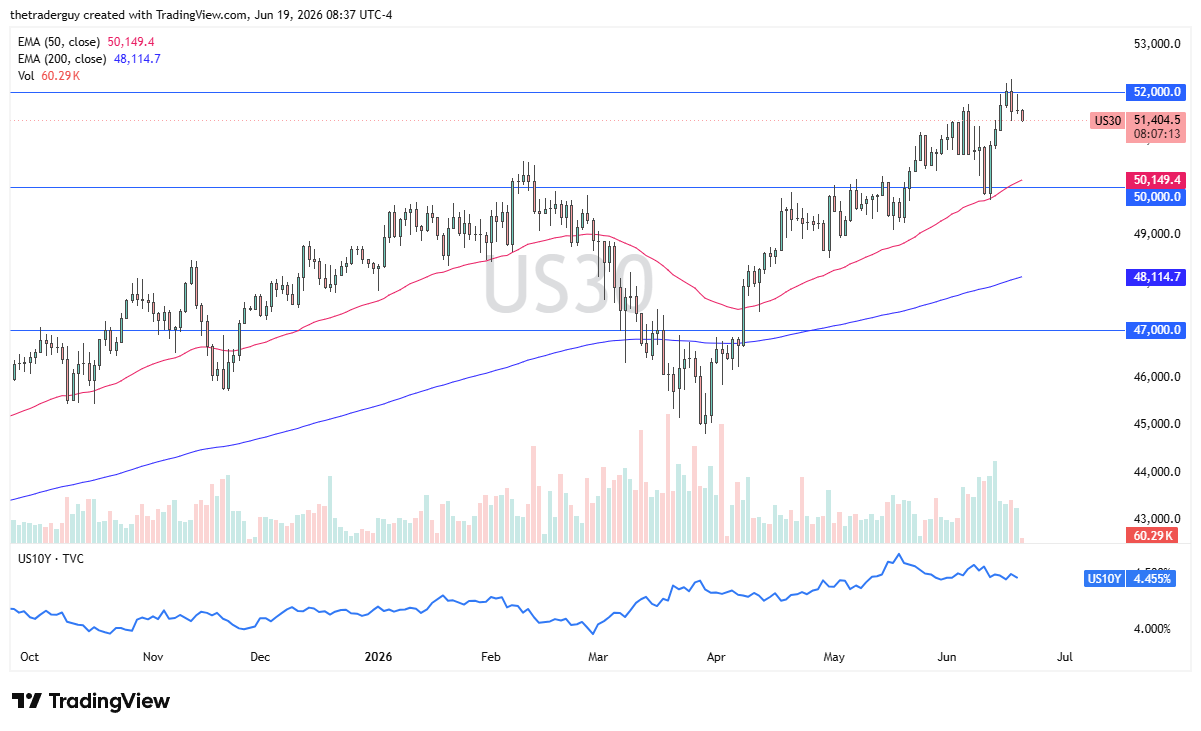
The Dow Jones 30 fell a bit in premarket trading in what would be a holiday session. All things being equal, though, this is a market that, as soon as I start to see the buyers return, I get long. There’s no point in shorting this. You’re not going to pick the top in a market that looks like it does. It’s been basically 6 years of either up or sideways action with a couple of short-term pullbacks. There’s really nothing on this chart that suggests that’s going to change anytime soon.
S&P 500 Technical Analysis
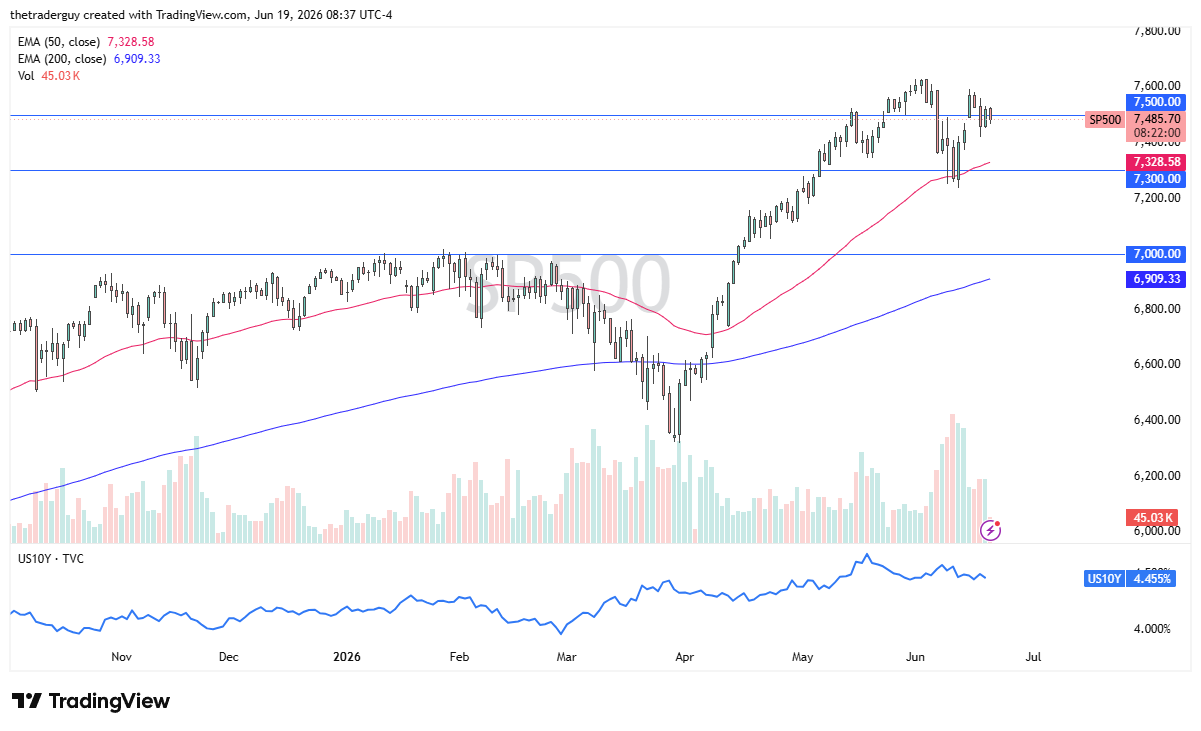
The S&P 500 has pulled back just a touch as well. We continue to hang around the 7,500 level, which is an area that remains important. I don’t really see much in this chart. Obviously, the S&P 500 itself was not at work, the underlying index on Friday, so this comes down to CFD traders, probably futures traders out there squaring off positions before they go home for the weekend.
NASDAQ 100 Price Forecast
Every new NASDAQ 100 analysis as it publishes, today's technical signal and key levels, live price — on one page.
See all NASDAQ 100 forecastsReally, at this point in time, still a positive market. I think we’re going to enter some sideways action, which makes sense this time of year anyway. So, I will continue to buy the dips. I think it’s probably only a matter of time before we break out to the upside.
If you’d like to know more about chart patterns and how to trade them, please visit our educational area.