XLU (Utilities) Technical Analysis
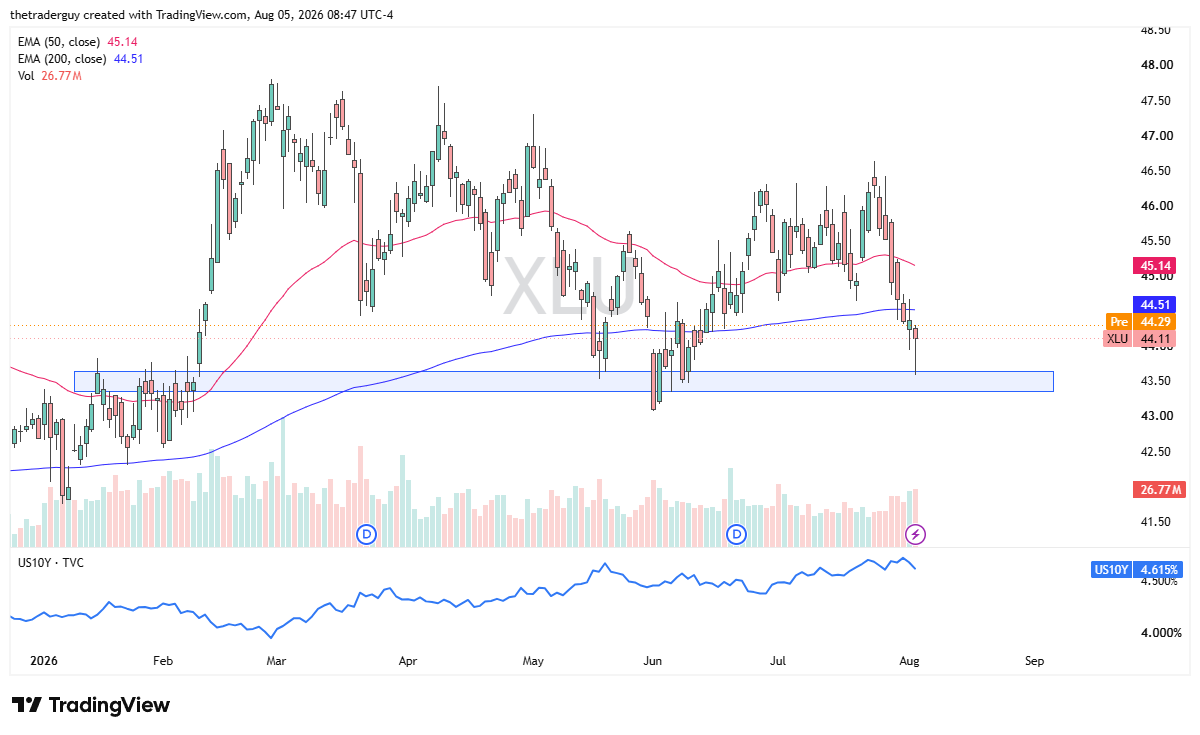
The XLU or the Utilities ETF looks like it’s going to jump a bit early based on pre-market trading. So therefore, I think we’ve got a situation where traders are looking at this through the prism of whether or not we can pick up a little bit of momentum. The market is one that typically is a little bit of a safety play, so this is interesting to see how we have bounced off this support.
And with that being the case, if we can break from here, we’ll test the 200-day EMA first and possibly try to grind our way back to the top of the range if momentum can pick up. For myself, I actually like the utilities as a small part of a portfolio, almost like a little bit of insurance. It looks like we are at least trying to defend the range.

XLF (Financials) Technical Analysis
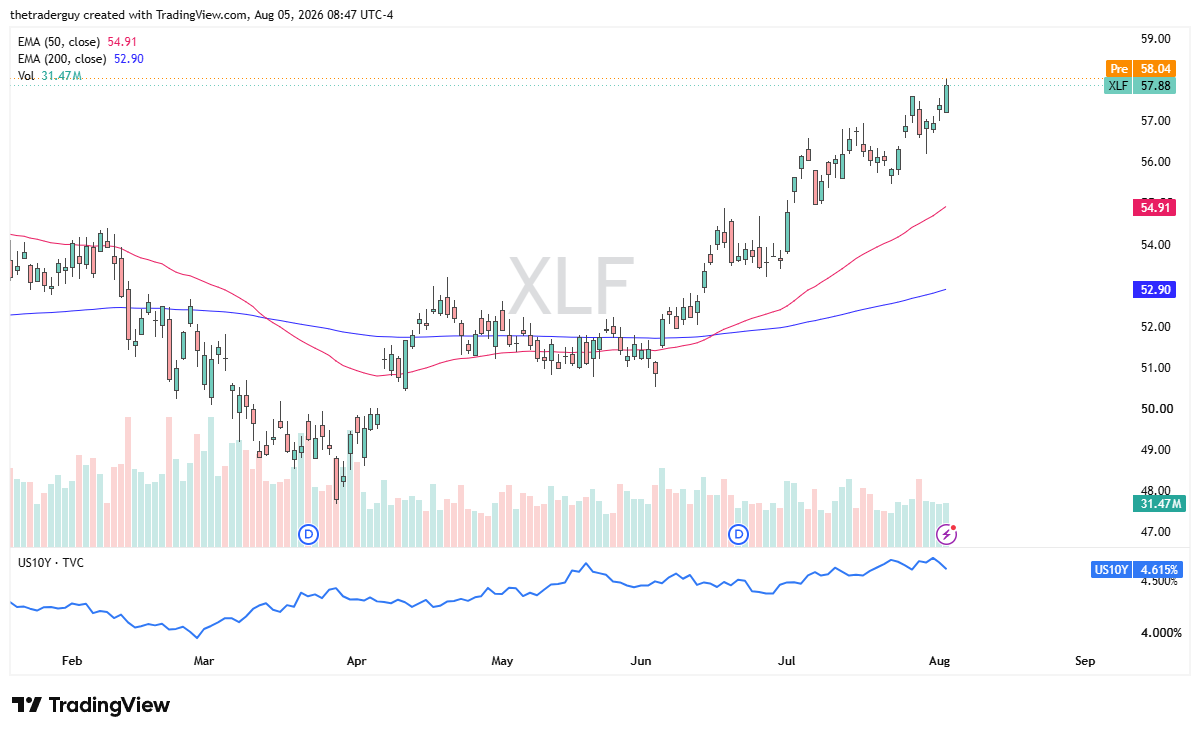
The XLF, or financials, looks like it is going to gap higher during the day and just continue to rise. This has been a nice channel for some time and a nice 45-degree angle. I don’t see anything on this chart personally that changes that attitude. Slow and steady is the way this one goes as it goes higher over the last couple of months, and it looks like we’re going to get more of the same here on Wednesday so far.
XLK (Technology) Technical Analysis
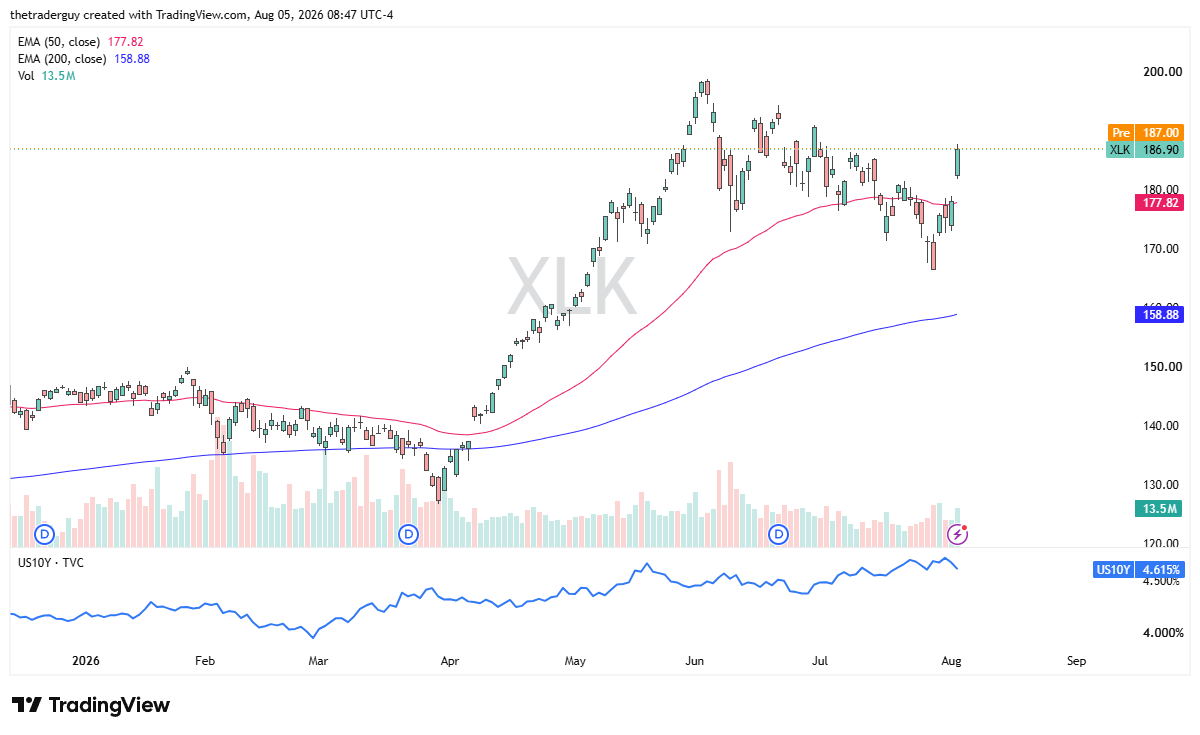
XLK, now this is the technology sector. It looks like it’s going to open up about 10 cents above where it closed, but it’s worth noting that on Tuesday it just launched. And with the earnings season going the way it is and the sudden reemergence of certain high-flying technology companies in the last couple of days, this does make sense.
Certainly looks like it’s trying to continue the upward momentum. If rates continue to drop, historically speaking, that’s good for tech companies; we’ll have to see if that plays out. Certainly, a healthy-looking chart.
If you’d like to know more about technical analysis and how traders use it, please visit our educational area.