



Key Insights
- Core Retail Sales drop by 0.6%, hinting at consumer spending contraction, influencing Nasdaq and S&P 500.
- Empire State and Philly Fed Manufacturing Indices show mixed signals, impacting Dow’s market sentiment.
- Unemployment claims at 212K offer slight optimism amidst economic uncertainties for major indices.
Fundamental Outlook
Recent economic data revealed a mixed picture for the U.S. economy, impacting major indices like Nasdaq, S&P 500, and Dow. Core Retail Sales declined by 0.6%, missing expectations and indicating a contraction in consumer spending.
The Empire State Manufacturing Index improved slightly to -2.4, suggesting less contraction than anticipated. Retail Sales also fell by 0.8%, further signaling a slowdown. Unemployment claims were slightly better than expected at 212K, offering a glimmer of hope.
The Philly Fed Manufacturing Index posted a surprising rebound to 5.2, hinting at potential manufacturing sector resilience.
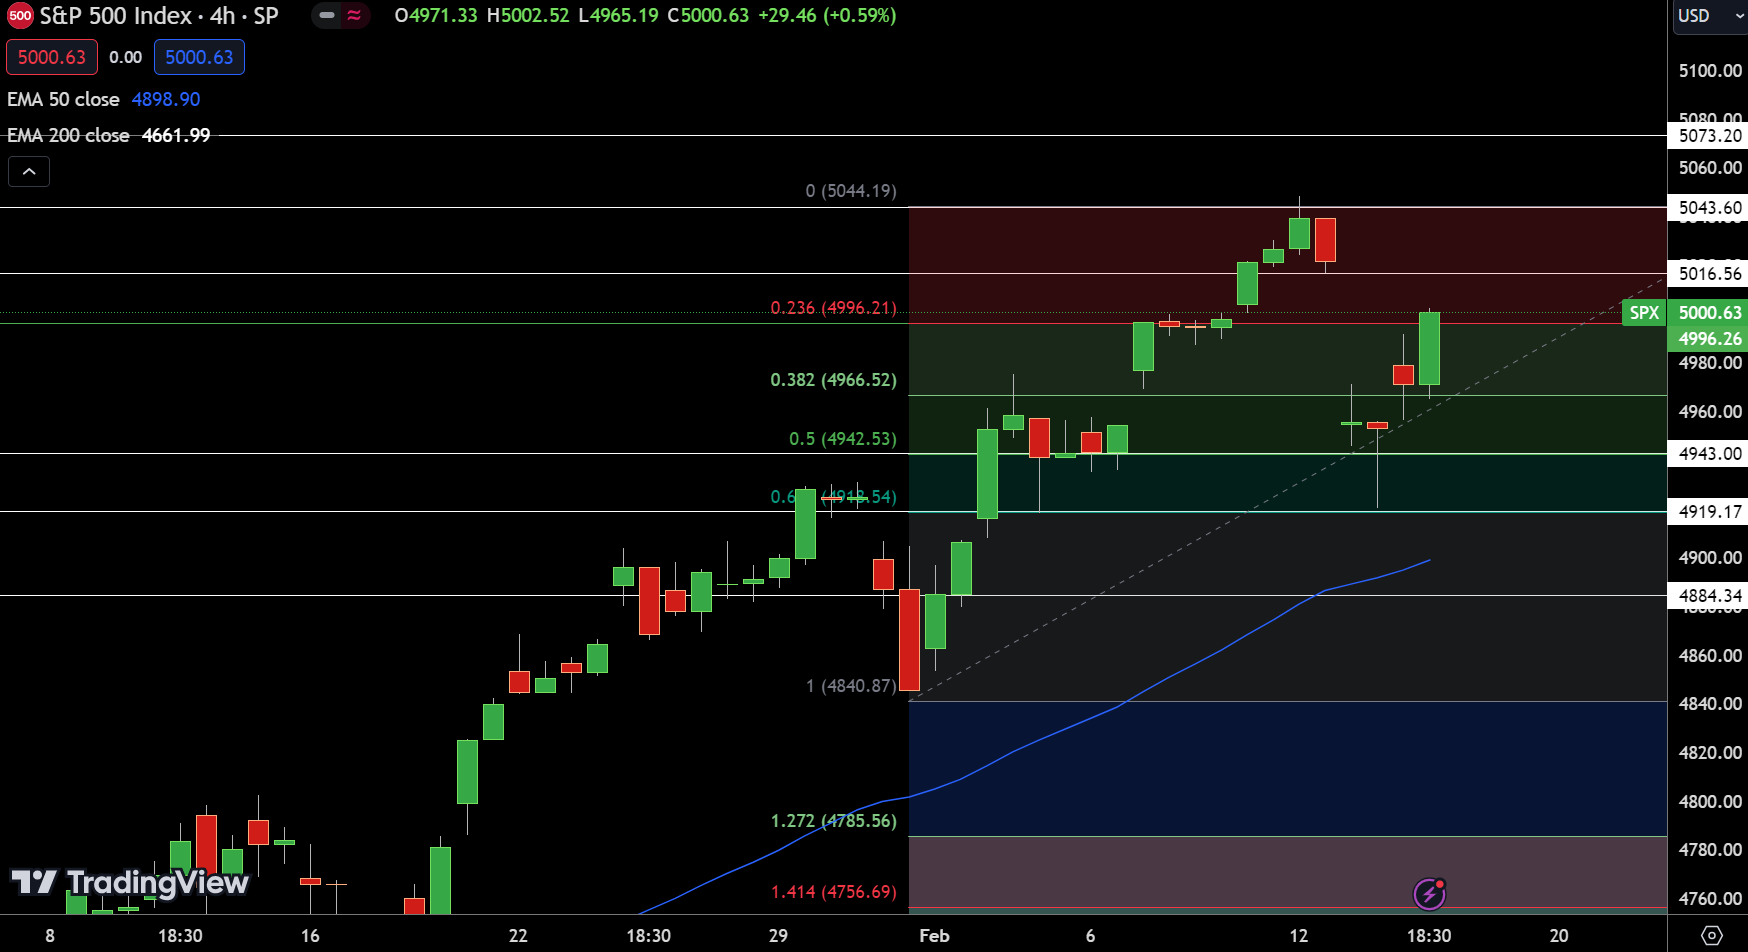
The S&P 500 index is navigating through critical junctures, with the current pivot point set at $4996.26. This threshold delineates the potential for upward or downward momentum. Resistance is found progressively at $5016.56, $5043.60, and $5073.20, indicating key levels where the index might face hurdles. Support lies at $4943.00, with further layers at $4919.17 and $4884.34, offering potential rebound zones.
Technical analysis shows the 50-Day Exponential Moving Average (EMA) at $4898.90 and the 200-Day EMA at $4661.99, both supporting a bullish sentiment when the index is above the pivot. The positioning above the $50 EMA, in particular, suggests a positive outlook, provided the index remains above $4996.26.
This configuration points to an anticipatory stance among investors, with movements above this pivot likely to reinforce bullish trends.
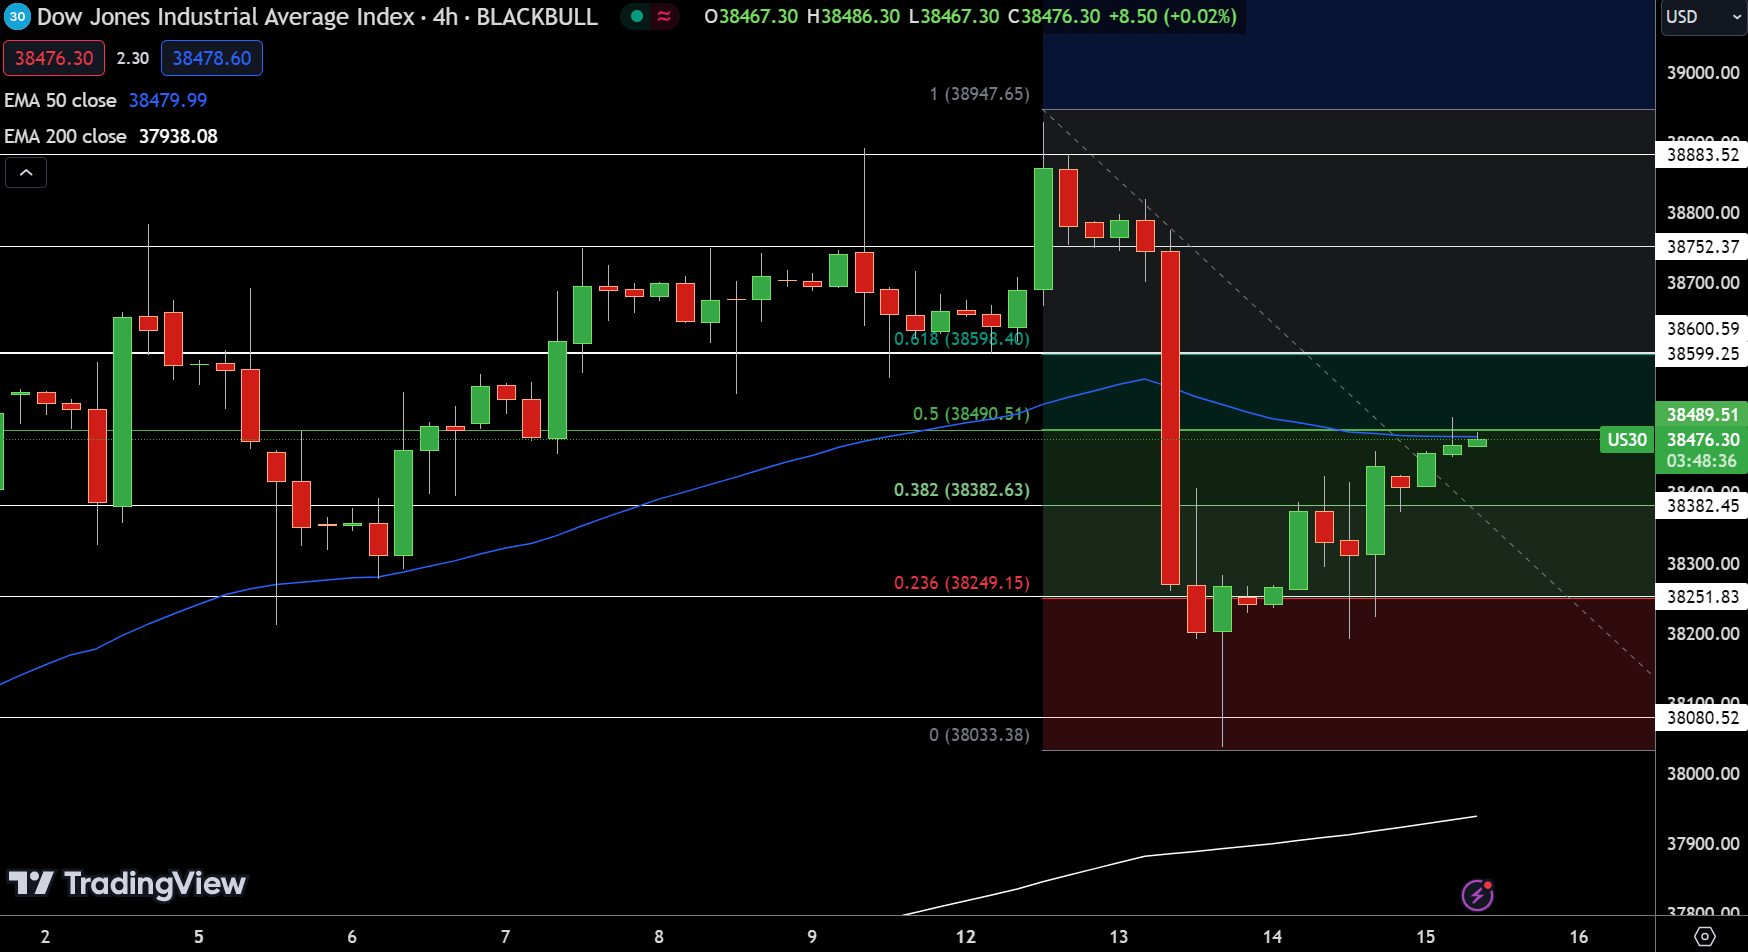
Dow Price Forecast
NASDAQ Price Forecast
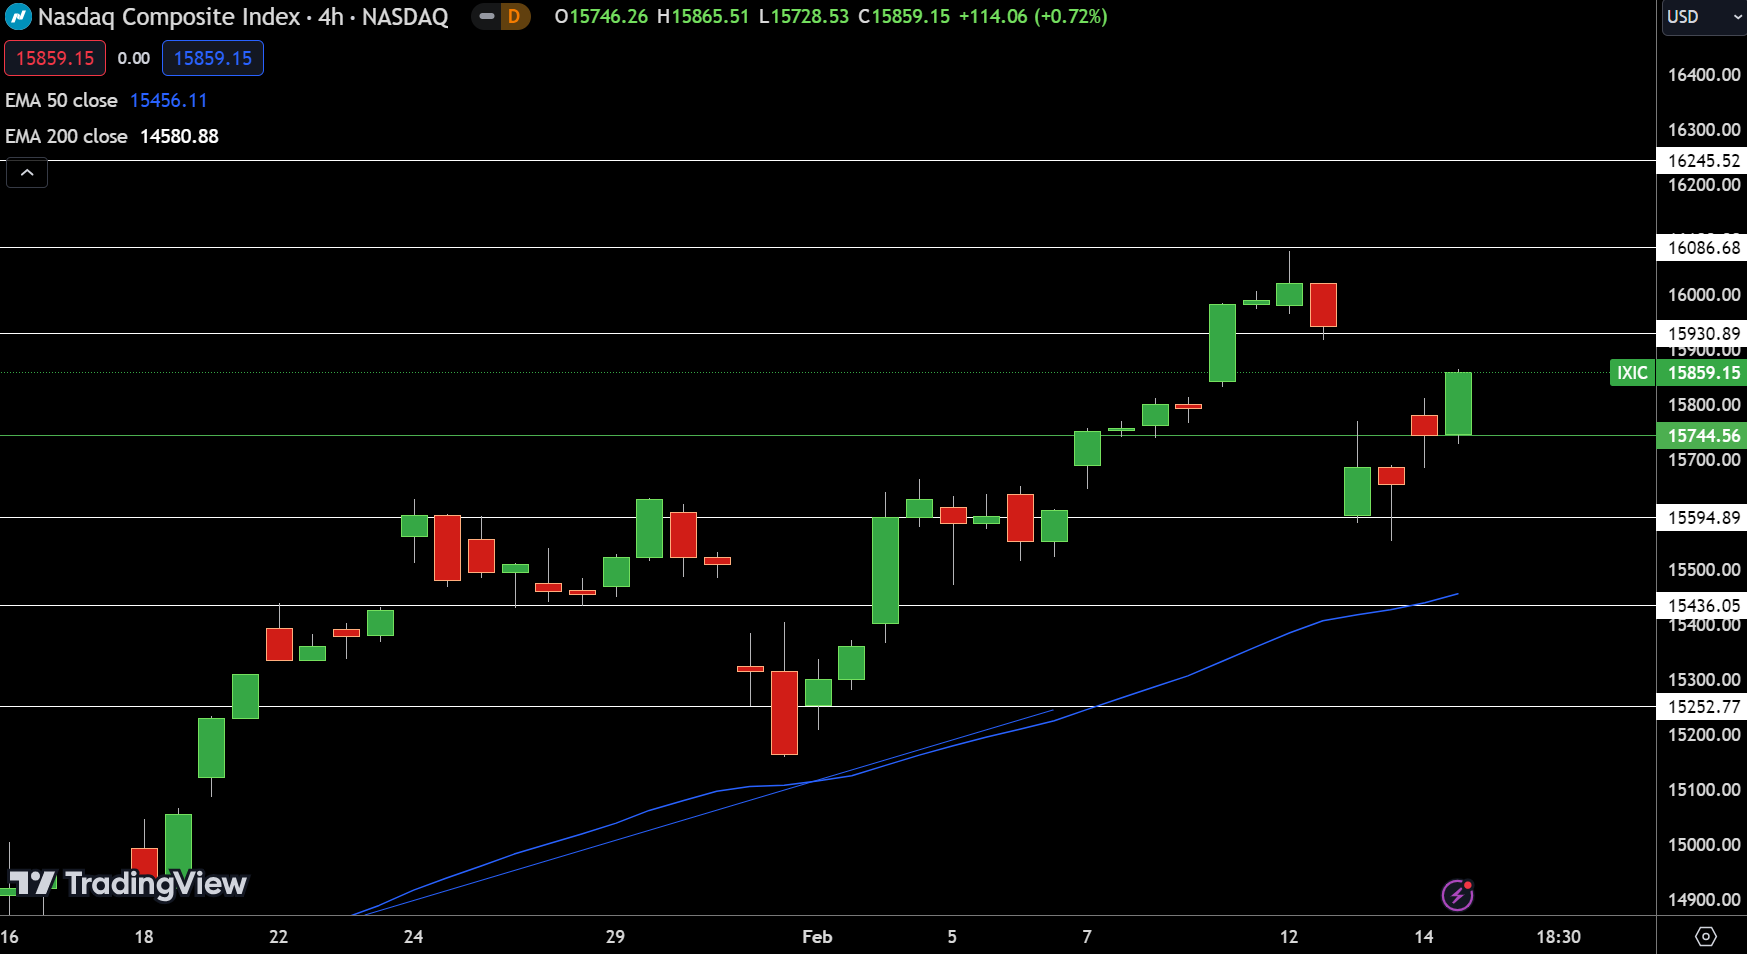
The NASDAQ Composite Index’s pivot point is established at $15,744.56. This level serves as a demarcation line for the index’s immediate direction. Resistance is observed at $15,930.89, progressing to $16,086.68, and further extending to $16,245.52, which delineates potential hurdles for upward movement. On the downside, support positions itself at $15,594.89, followed by $15,436.05, and deeper at $15,252.77, outlining areas where the index might find footing for a rebound.
The 50-Day Exponential Moving Average (EMA) at $15,456.11 and the 200-Day EMA at $14,580.88 both underscore a bullish sentiment for the NASDAQ, especially as the index floats above these levels. Given the index’s current position above the pivot point, the NASDAQ exhibits a bullish potential, indicating that movements above $15,744.56 could further solidify this trend.
For a look at all of today’s economic events, check out our economic calendar.