



Oil Prices Gain on U.S. Demand Optimism and Dollar’s Dip Amid Refinery Restarts
Oil prices edged higher for the second consecutive day, fueled by optimism for increased demand in the United States, the leading global oil consumer, amid refinery restarts after outages and a weakening dollar.
Market strategist Yeap Jun Rong highlighted oil’s resilience, suggesting a potential retest of year-to-date highs, supported by geopolitical tensions. However, an unexpected rise in U.S. crude stocks could temper gains, awaiting further cues from upcoming Energy Information Administration inventory data.
Significant refinery outages have contributed to increased crude inventories, though recovery efforts are underway, with major refineries like BP’s in Indiana and Total Energies’ in Texas poised for full production resumption.
The weaker dollar also played a role in bolstering crude prices, making oil more affordable internationally.
Natural Gas Price Forecast
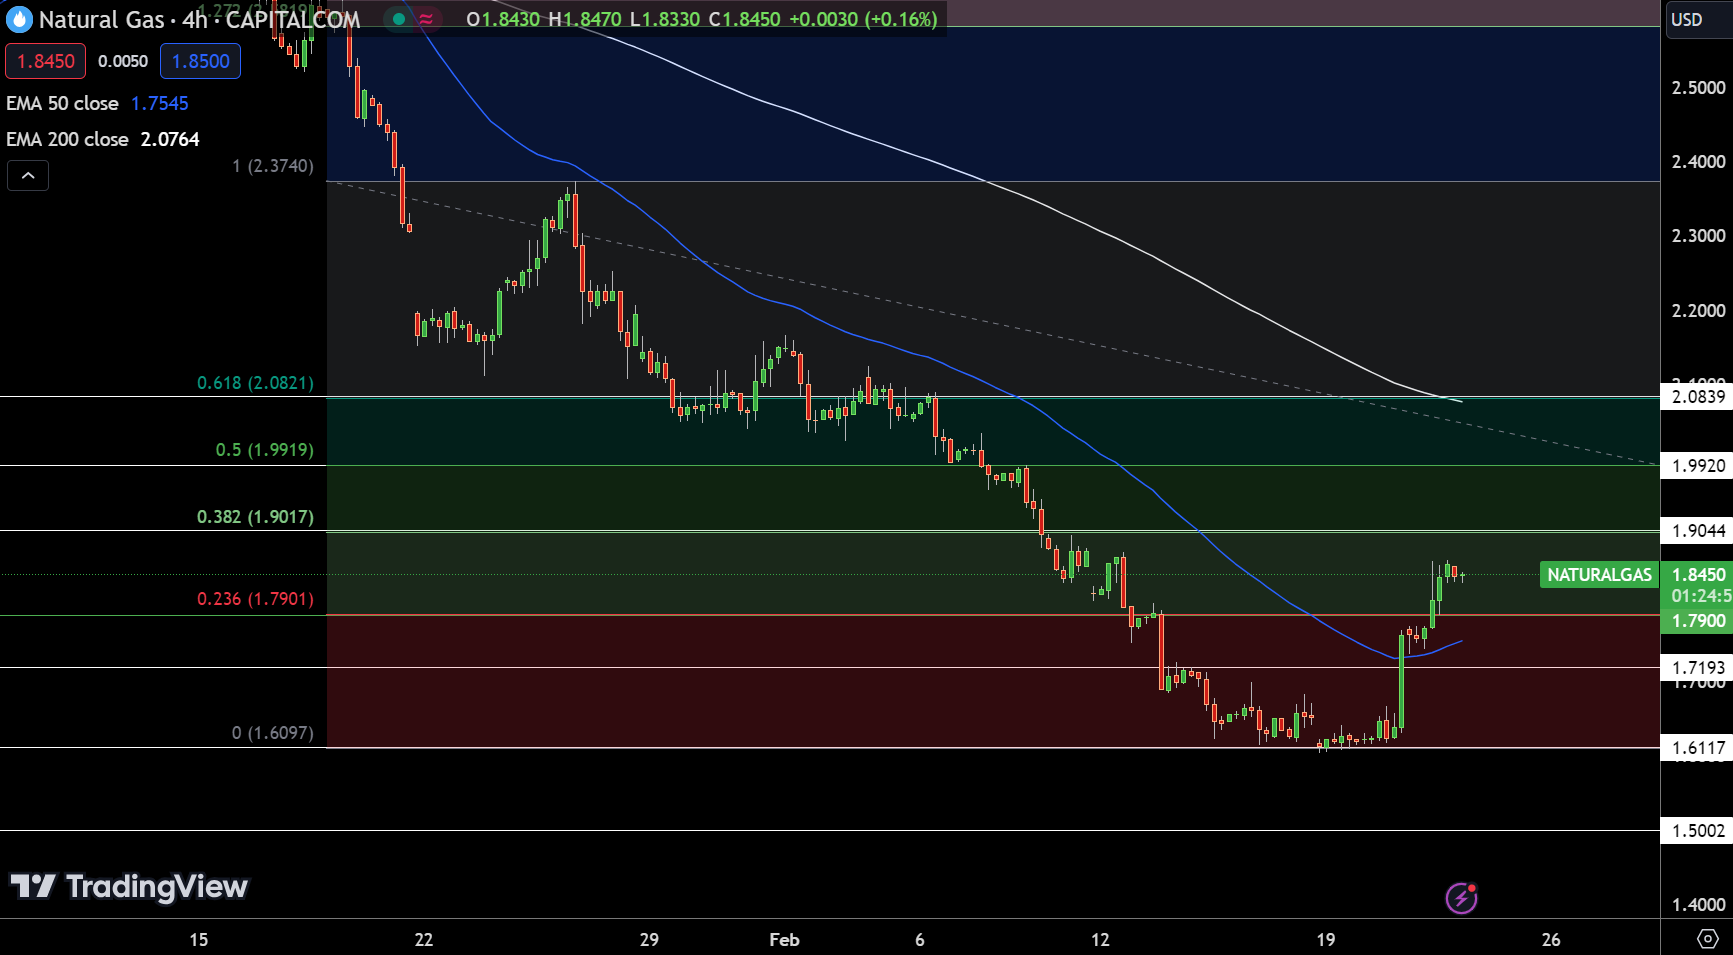
On February 22, Natural Gas (NG) experienced a slight decline of 0.70%, settling at $1.8480. The commodity currently trades just above its pivot point of $1.8450, hinting at a cautiously optimistic outlook. Key resistance levels are identified at $1.9044, $1.9920, and $2.0839, which could cap upward movements.
Conversely, support levels are found at $1.7193, $1.6117, and $1.5002, offering potential rebound points. The 50-day Exponential Moving Average (EMA) at $1.7545 and the 200-day EMA at $2.0764 indicate a mixed sentiment.
Given this, the trend for NG is bullish above the pivot point of $1.8450, suggesting that prices may incline if they remain above this critical threshold.
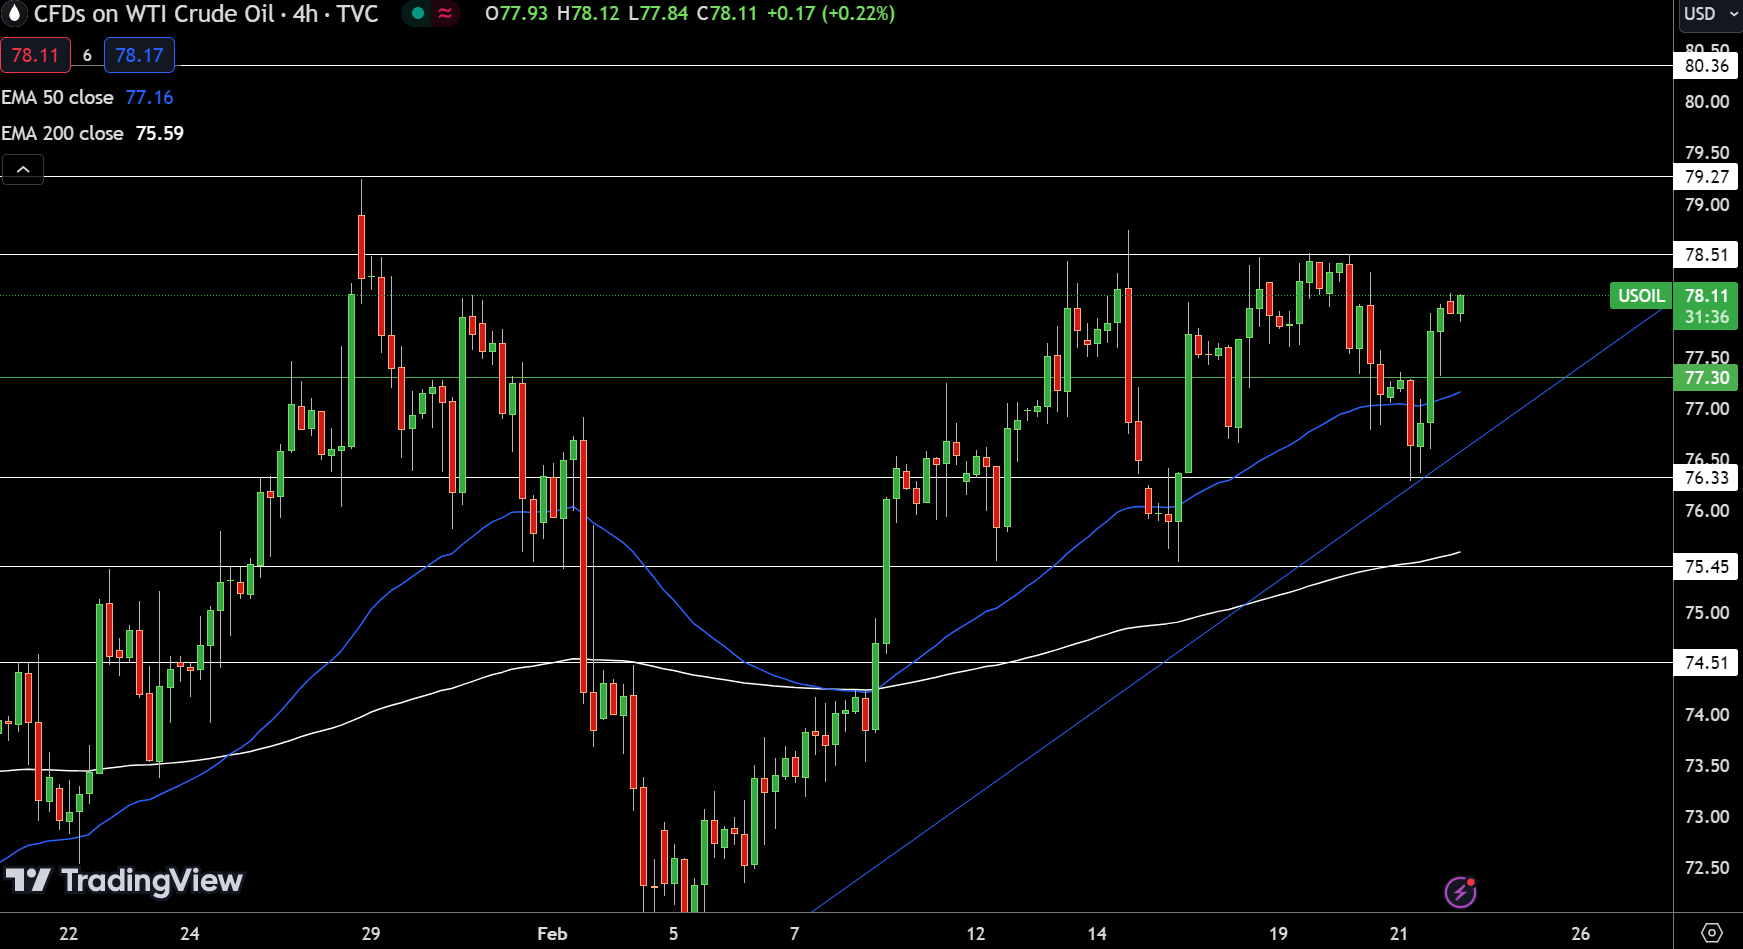
On February 22, USOIL‘s edged higher, marking a 0.22% increase to $78.14. Positioned above its pivot point of $77.30, the commodity exhibits bullish signals. Resistance levels are set at $78.51, $79.27, and $80.36, indicating potential upward movement barriers.
Conversely, support can be found at $76.33, followed by $75.45 and $74.51, serving as cushions against downward trends. The 50-day and 200-day Exponential Moving Averages (EMAs) at $77.16 and $75.59, respectively, further validate the bullish outlook.
Given these dynamics, USOIL’s trend leans bullish as long as it maintains above the $77.30 benchmark, hinting at continued upward momentum in the near term.
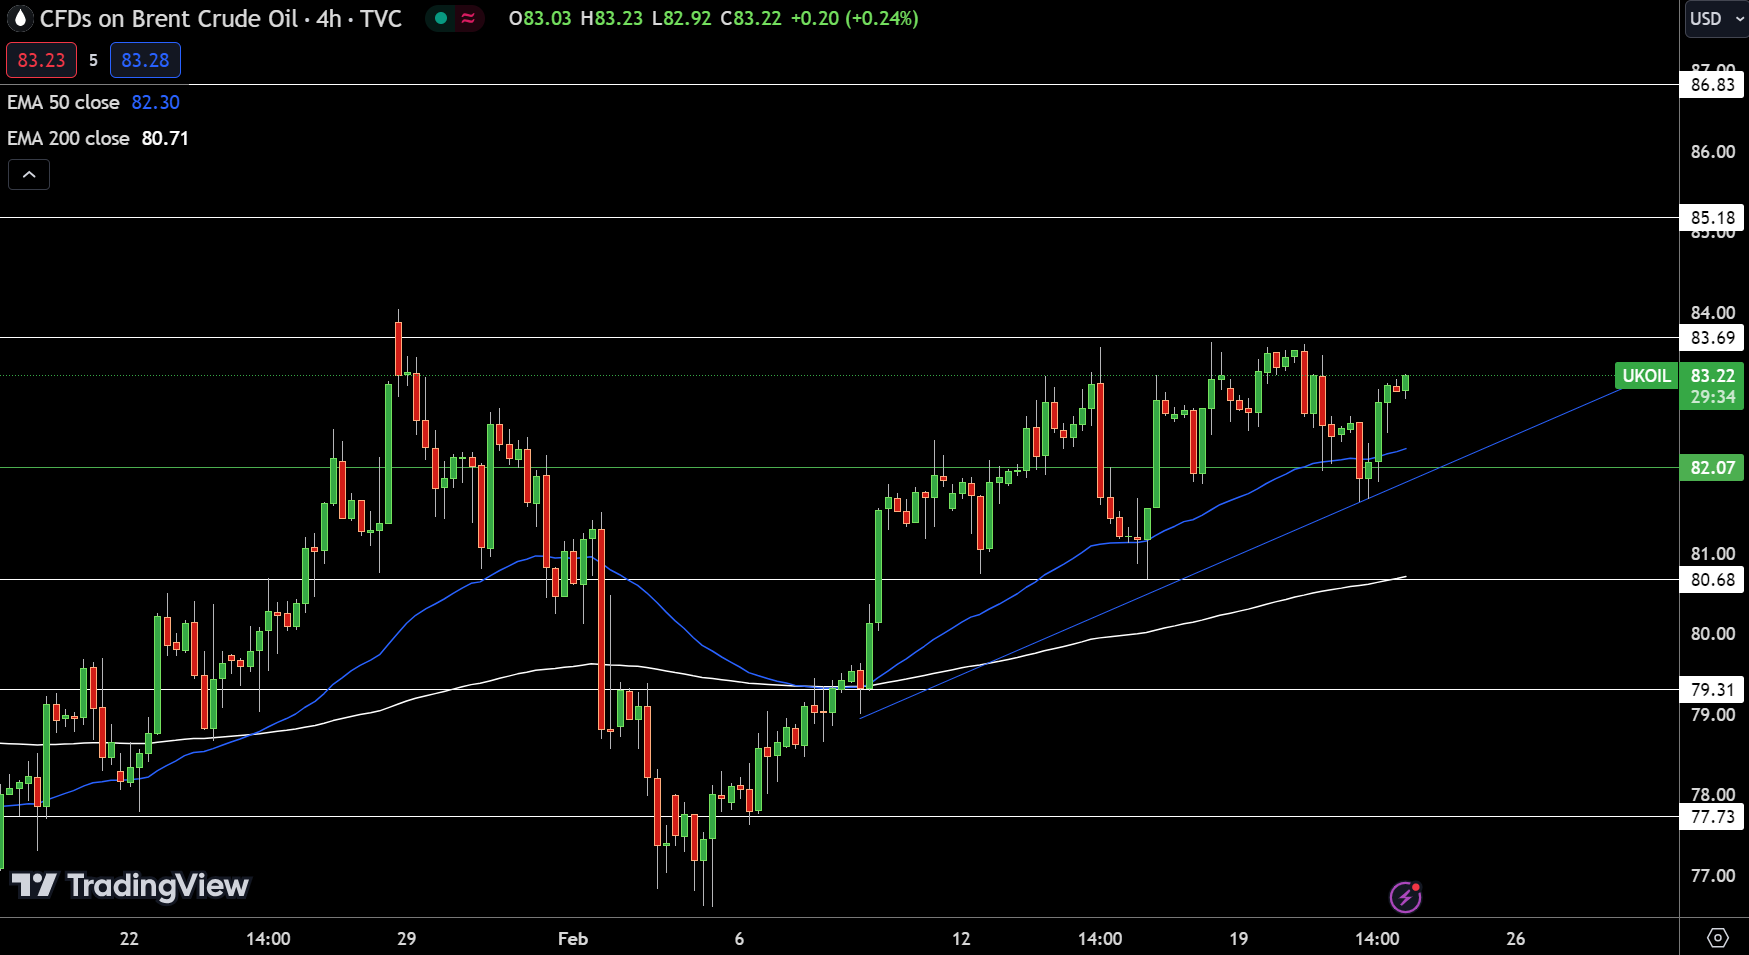
UK OIL registered a modest increase of 0.19%, reaching $82.25. The commodity’s price is slightly above its pivot point at $82.07, signaling a potential uptrend. Resistance is anticipated at $83.69, followed by $85.18 and $86.83, which could pose challenges to further gains.
Support levels are established at $80.68, $79.31, and $77.73, providing a safety net against declines. The 50-day Exponential Moving Average (EMA) at $82.30 and the 200-day EMA at $80.71 reinforce a bullish sentiment.
Given these indicators, the outlook for UK Oil remains bullish as long as it stays above the pivotal $82.07 mark.