
Oil News: OPEC Cuts Demand Outlook Amid Middle East Risks
Oil markets have been unsteady for some time now due to geopolitical risks, but OPEC’s supply and demand data illustrate a change. OPEC reduced their forecast for global oil demand growth in 2026 for the third month in a row, estimating 2026 demand will grow by 780,000 barrels per day (previously, OPEC expected demand would grow by 970,000 barrels per day). OPEC has predicted a larger growth in demand for 2027, estimating 1.94 million barrels per day. OPEC+ crude production in June was 36.28 million barrels per day. This figure is about 3 million barrels per day (bpd) higher than May, as Gulf producers began to restore production after being disrupted.
The International Energy Agency also reports that oil supply rose to 98.8 million barrels per day after an increase of 4.1 million barrels per day in June. Oil supply is still lower than the supply levels that existed prior to the conflict, and ongoing issues in the Middle East are affecting supply.
Demand in the Natural Gas market is as strong as ever. Natural Gas in working supply in the U.S. is 2,922 billion cubic feet (Bcf). This is 175 Bcf more than the five-year average, but 23 Bcf less than the average last year. The EIA forecasts that U.S. LNG will be exported at an average of 17.4 Bcf/day in 2026. Improved export facilities are going to help the U.S. maintain the position of a major player in global gas markets.

Natural Gas Technical Analysis: Will a Break Above $2.94 End the Current Consolidation?
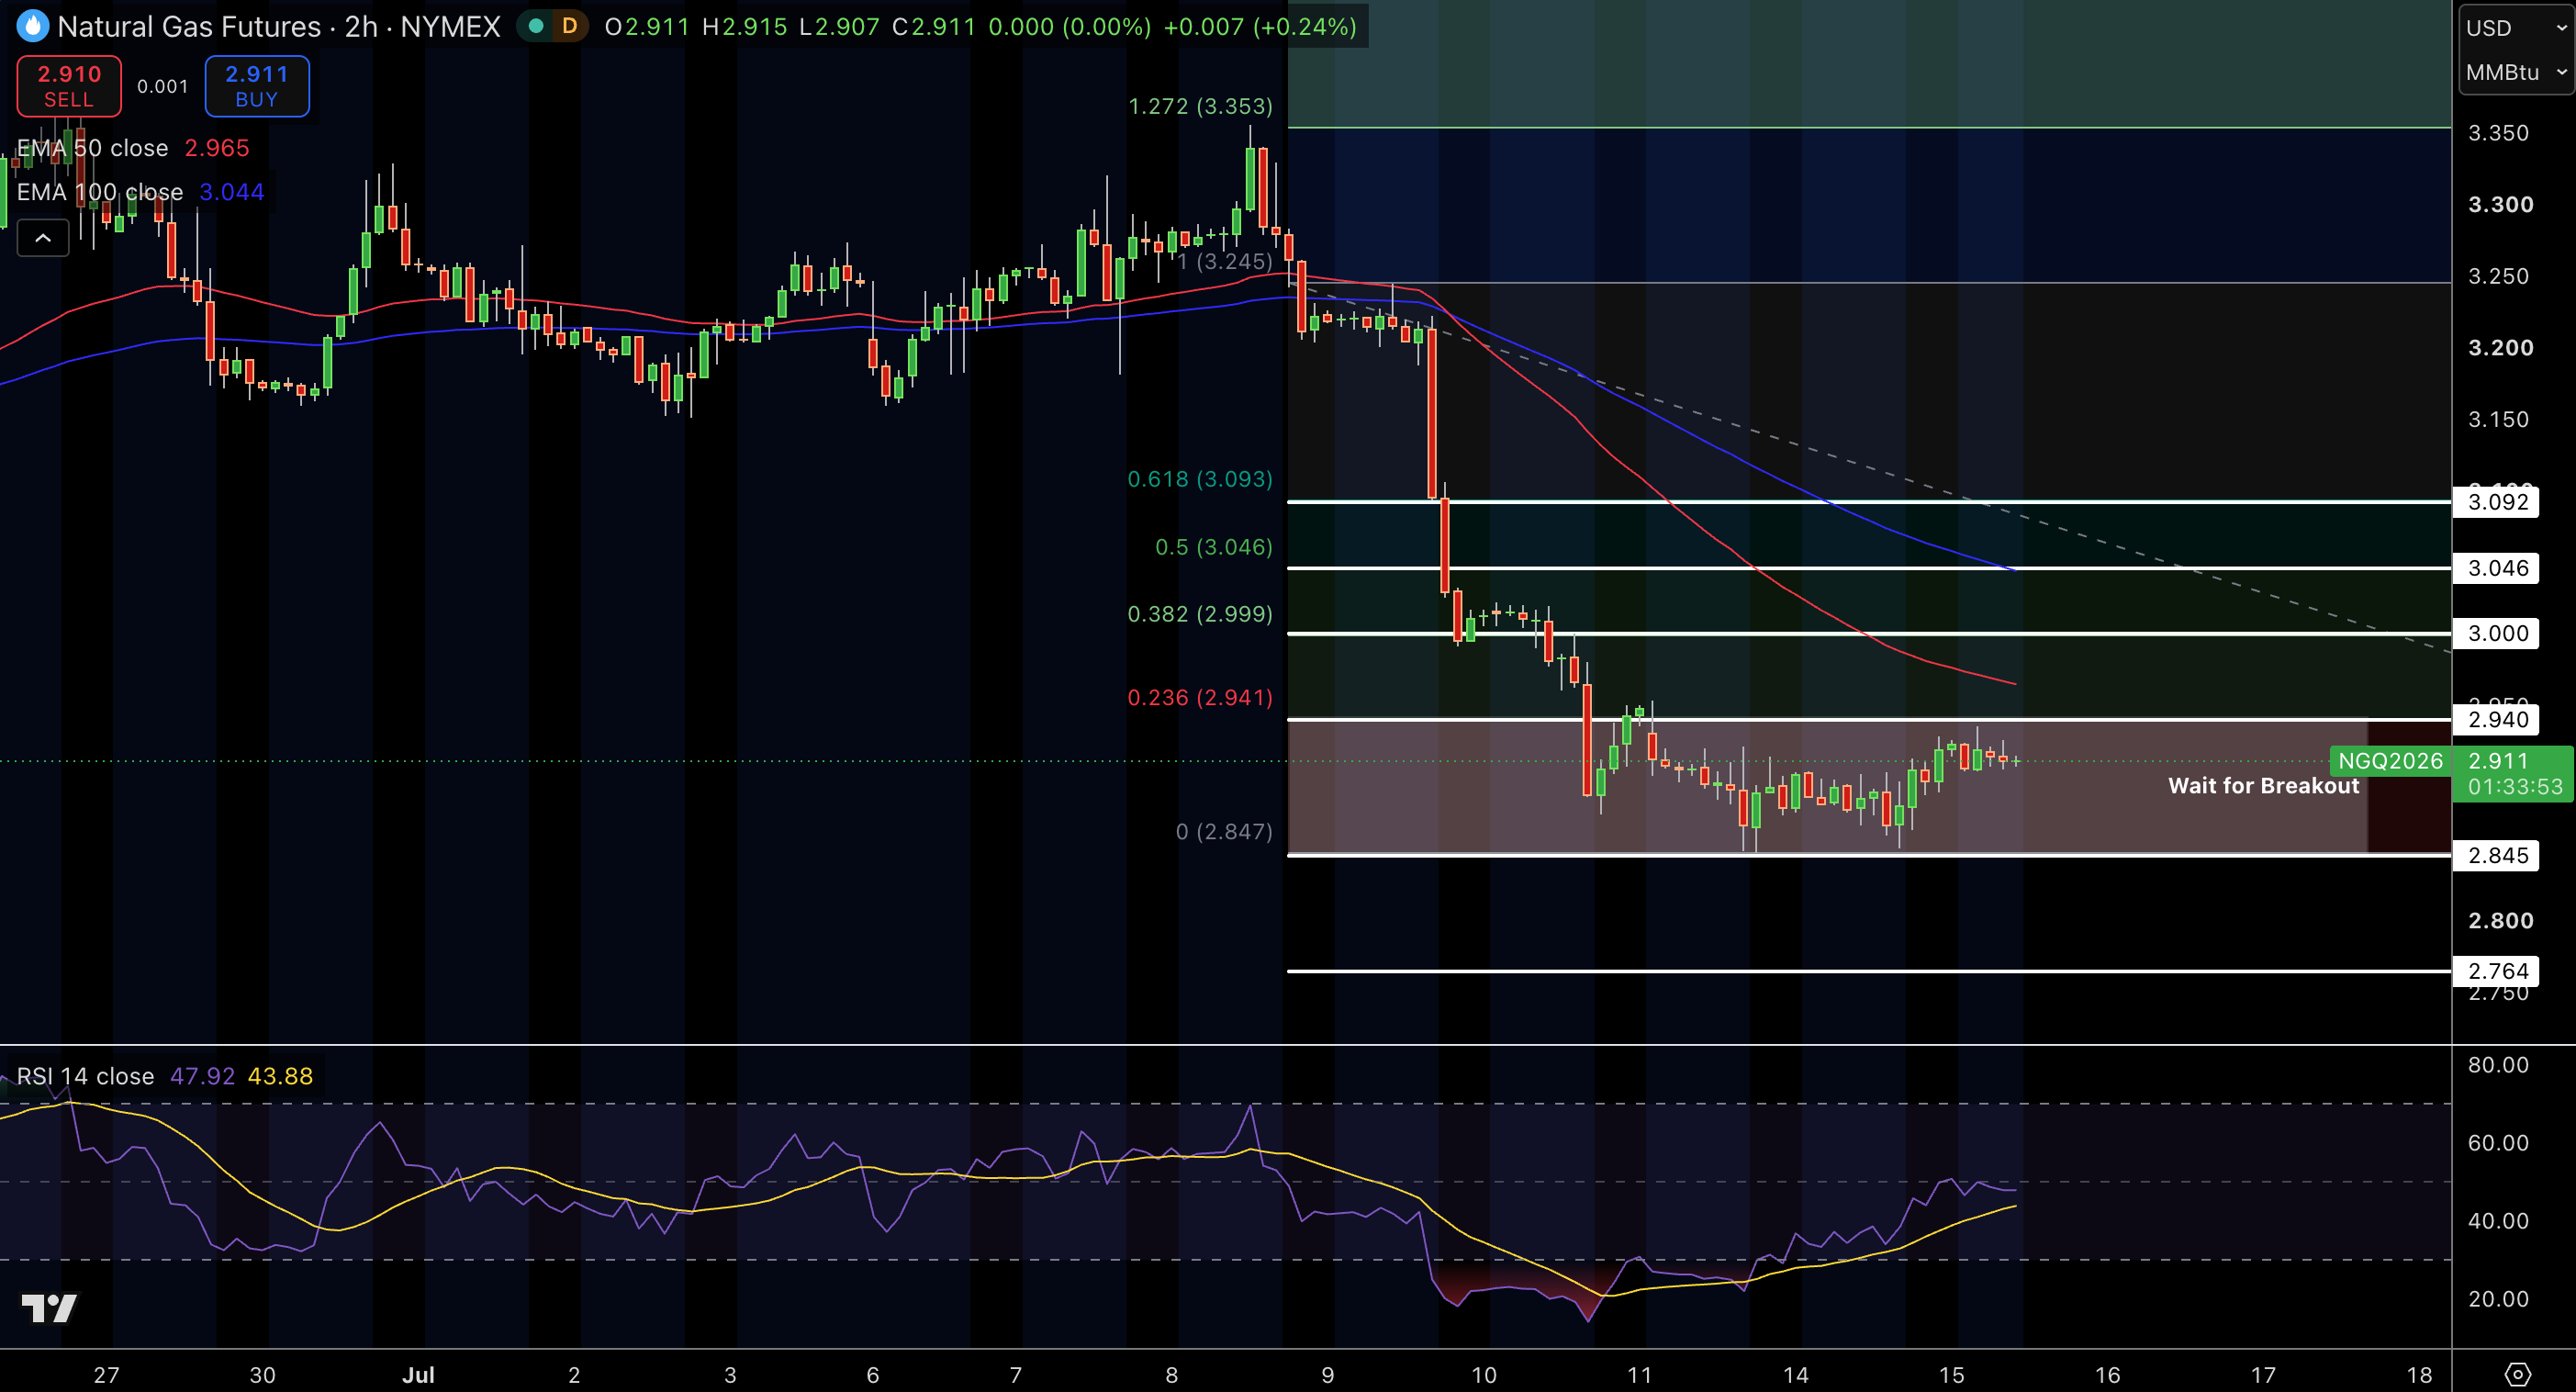
At a price of about $2.91, natural gas is trading after having been in a tight consolidation period windowed by $2.85 and $2.94. Today’s candlesticks show repeated pushbacks of higher resistance and lower support suggesting there is little conviction in any realized directions. The price is currently limboing below a bearish trendline. The price is also below the 50 day EMA ($2.97) and the 100 day EMA ($3.04) suggesting the short-term price action is bearish.
A Fibonacci retracement level of $2.94 is the first resistance, and $3.00 and $3.05 are higher resistances. $2.85 remains the most important support. The RSI is between 45 and 50 with little conviction of a price reversal in the natural gas market. With little confidence, I would set a limit at $2.94 with the price target of $3.00, and a sell order or stop limit set at $2.85.
WTI Crude Oil Technical Analysis: Can Bulls Push Through $80 Toward Fibonacci Resistance?
WTI Crude Oil is just below $79.74 as it continues to recover from the swing low of $66.83. Price remains above the rising trendline and the 50 EMA, indicating buyers are still present. Buyers are maintaining the price and are most likely to reverse. Price broke the previous descending trendline, positively impacting the medium-term outlook. Price is nearing resistance at $80.17, while the next upside target is the 0.618 Fibonacci at $83.37.
The next support is at $77.05 and then at $73.15. With the RSI at 66, some positive momentum exists. The RSI is close to the overbought area, likely to limit the price from moving up in the short term. Based on the analysis, purchase signals will be activated on a sustained move beyond $80.17 with a target of $83.30. The stop loss would be at $77.05.
Natural Gas Price Forecast
Every new Natural Gas analysis as it publishes, today's technical signal and key levels, live price — on one page.
See all Natural Gas forecastsBrent Crude Oil Technical Analysis: Is the Channel Breakout Opening the Door to $87.34?
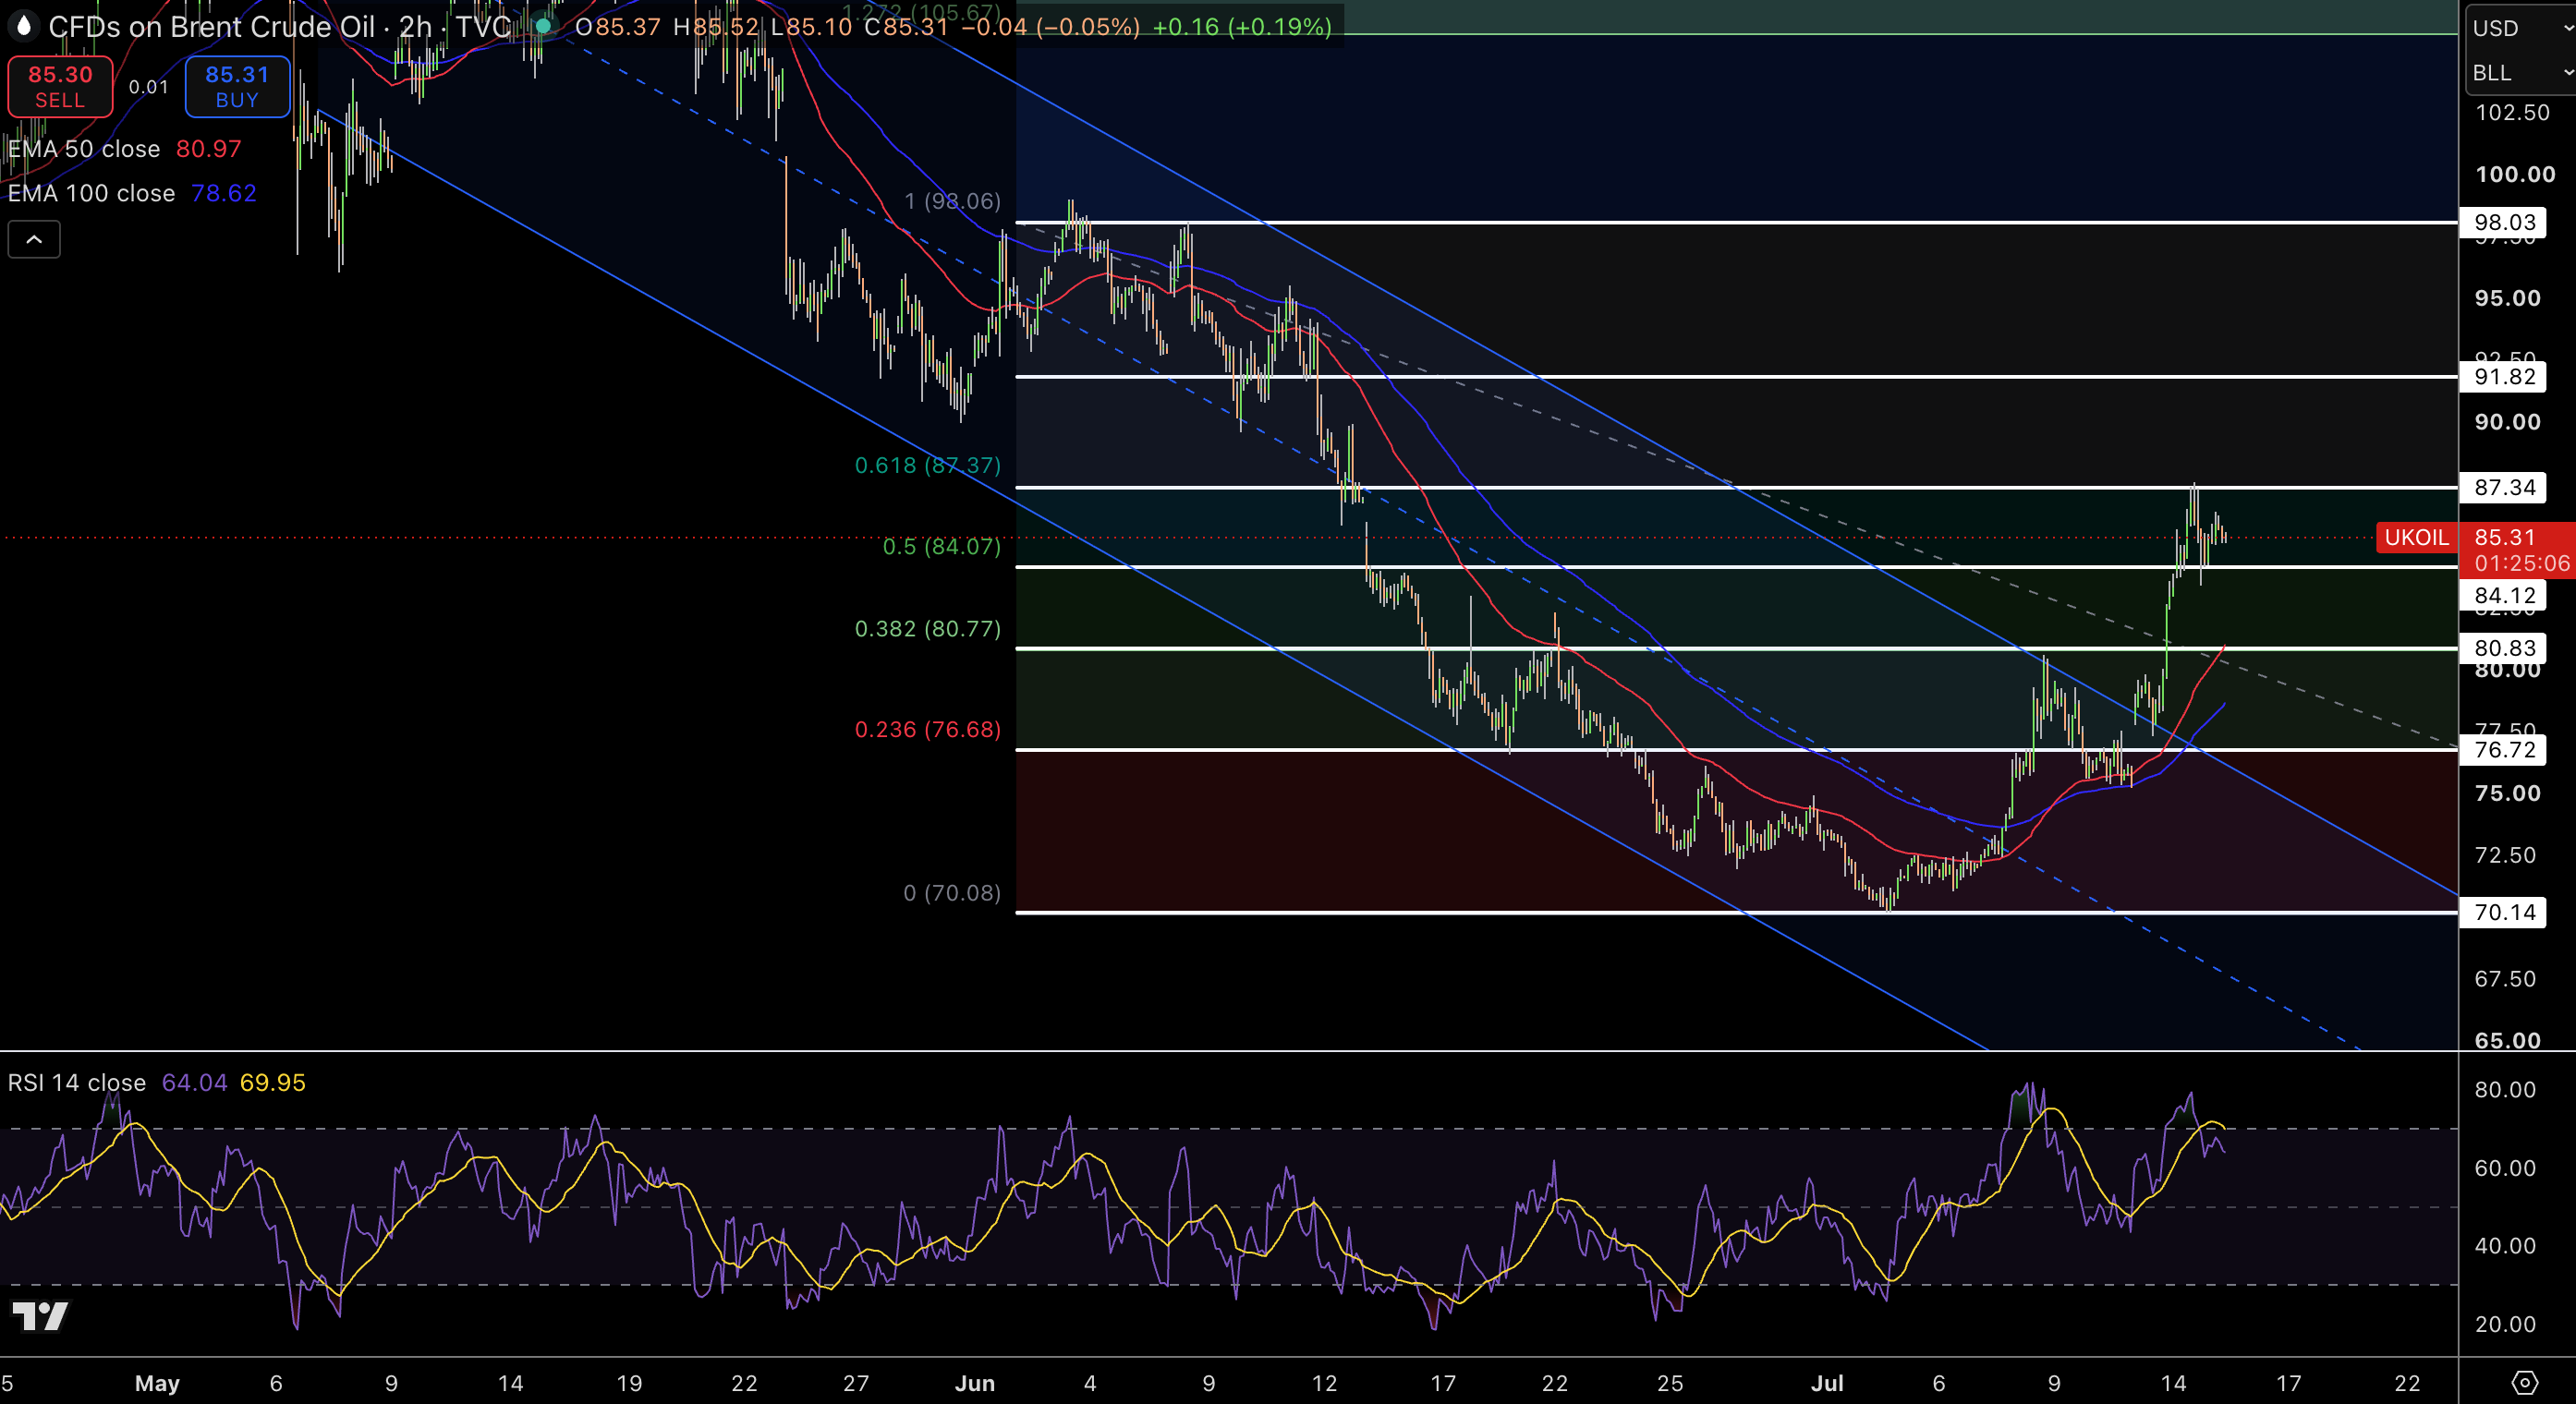
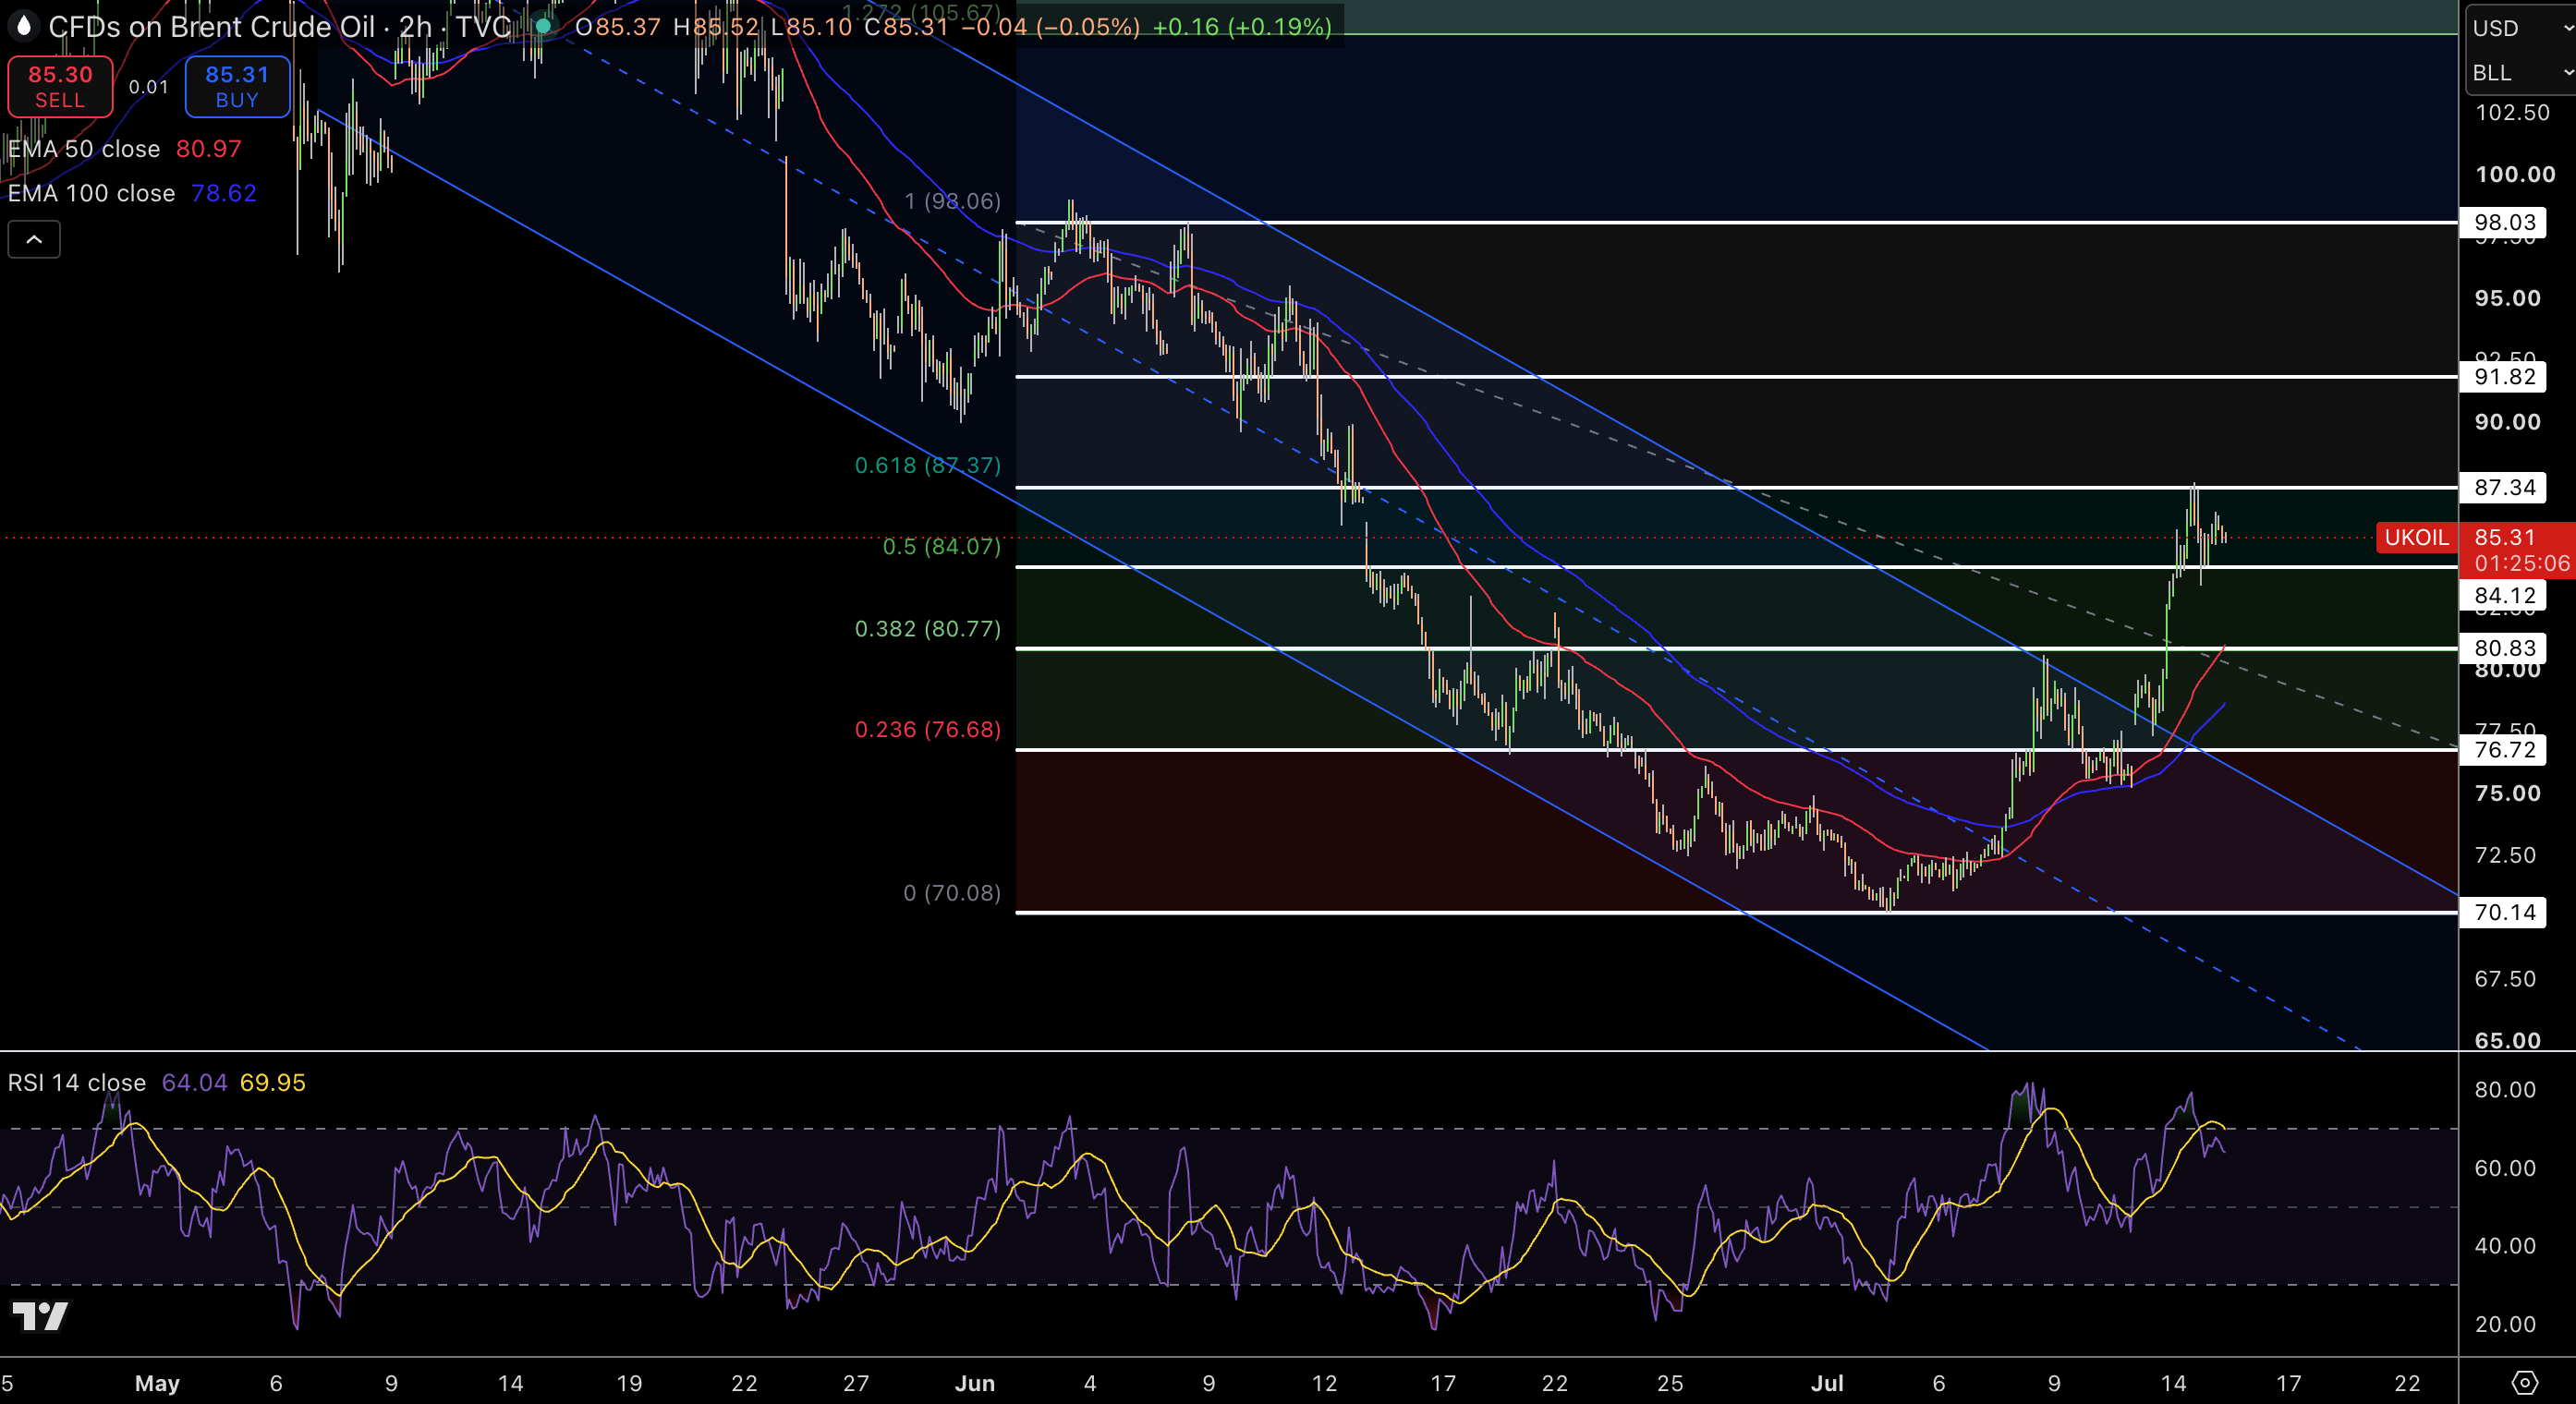
Brent is currently trading near $85.44 after breaking out of its long-term descending channel and the 0.50 Fibonacci level at $84.07. After breaking the 50 EMA and channel resistance, strong bullish candles indicated that market structure was improving. The most recent candlesticks show a small pause under $87.34. This shows that buyers are taking profits, but are still maintaining control. The former channel resistance is located at $84.12 and is acting as a support level.
The next important support level is $80.83, and would come into play with a strong pullback. The RSI is near 65, aligning with bullish momentum and indicating that the trend has not yet come to an end. Due to the analysis that I have done, I would only consider going long on a confirmed hold above $84.12, with a target of $87.34 and a stop loss at $80.83.