



US Dollar News: Softer Inflation Reshapes Fed Outlook
The evolving monetary policies, particularly with the release of June’s inflation numbers in the United States, are causing shifts in the value of the dollar, sterling and the euro. U.S. annual inflation for July fell to 3.5% from June’s 4.2%, with core inflation also falling, to 2.6%. This caused a rapid decrease in the projected likelihood of a July 28-29 Federal Reserve interest rate hike. Demand for U.S. futures implied only a 10% likelihood of a July hike. Earlier estimates placed U.S. interest rate hikes at a 35% probability, indicating the bulk of interest rate conjecture has moved to September.
The euro has risen in value with speculation that the European Central Bank will keep the deposit rate at 2.25% and also Curb inflation and growth in the euro region.
The pound also remains strong as it is expected the Bank of England will continue to err on the side of caution. U.K. inflation has also been little influenced by renewed Middle Eastern conflict. Governor Andrew Bailey remains focused on other economic data.

US Dollar Index Technical Analysis: Is DXY Building Momentum for a Move Toward $101.22?
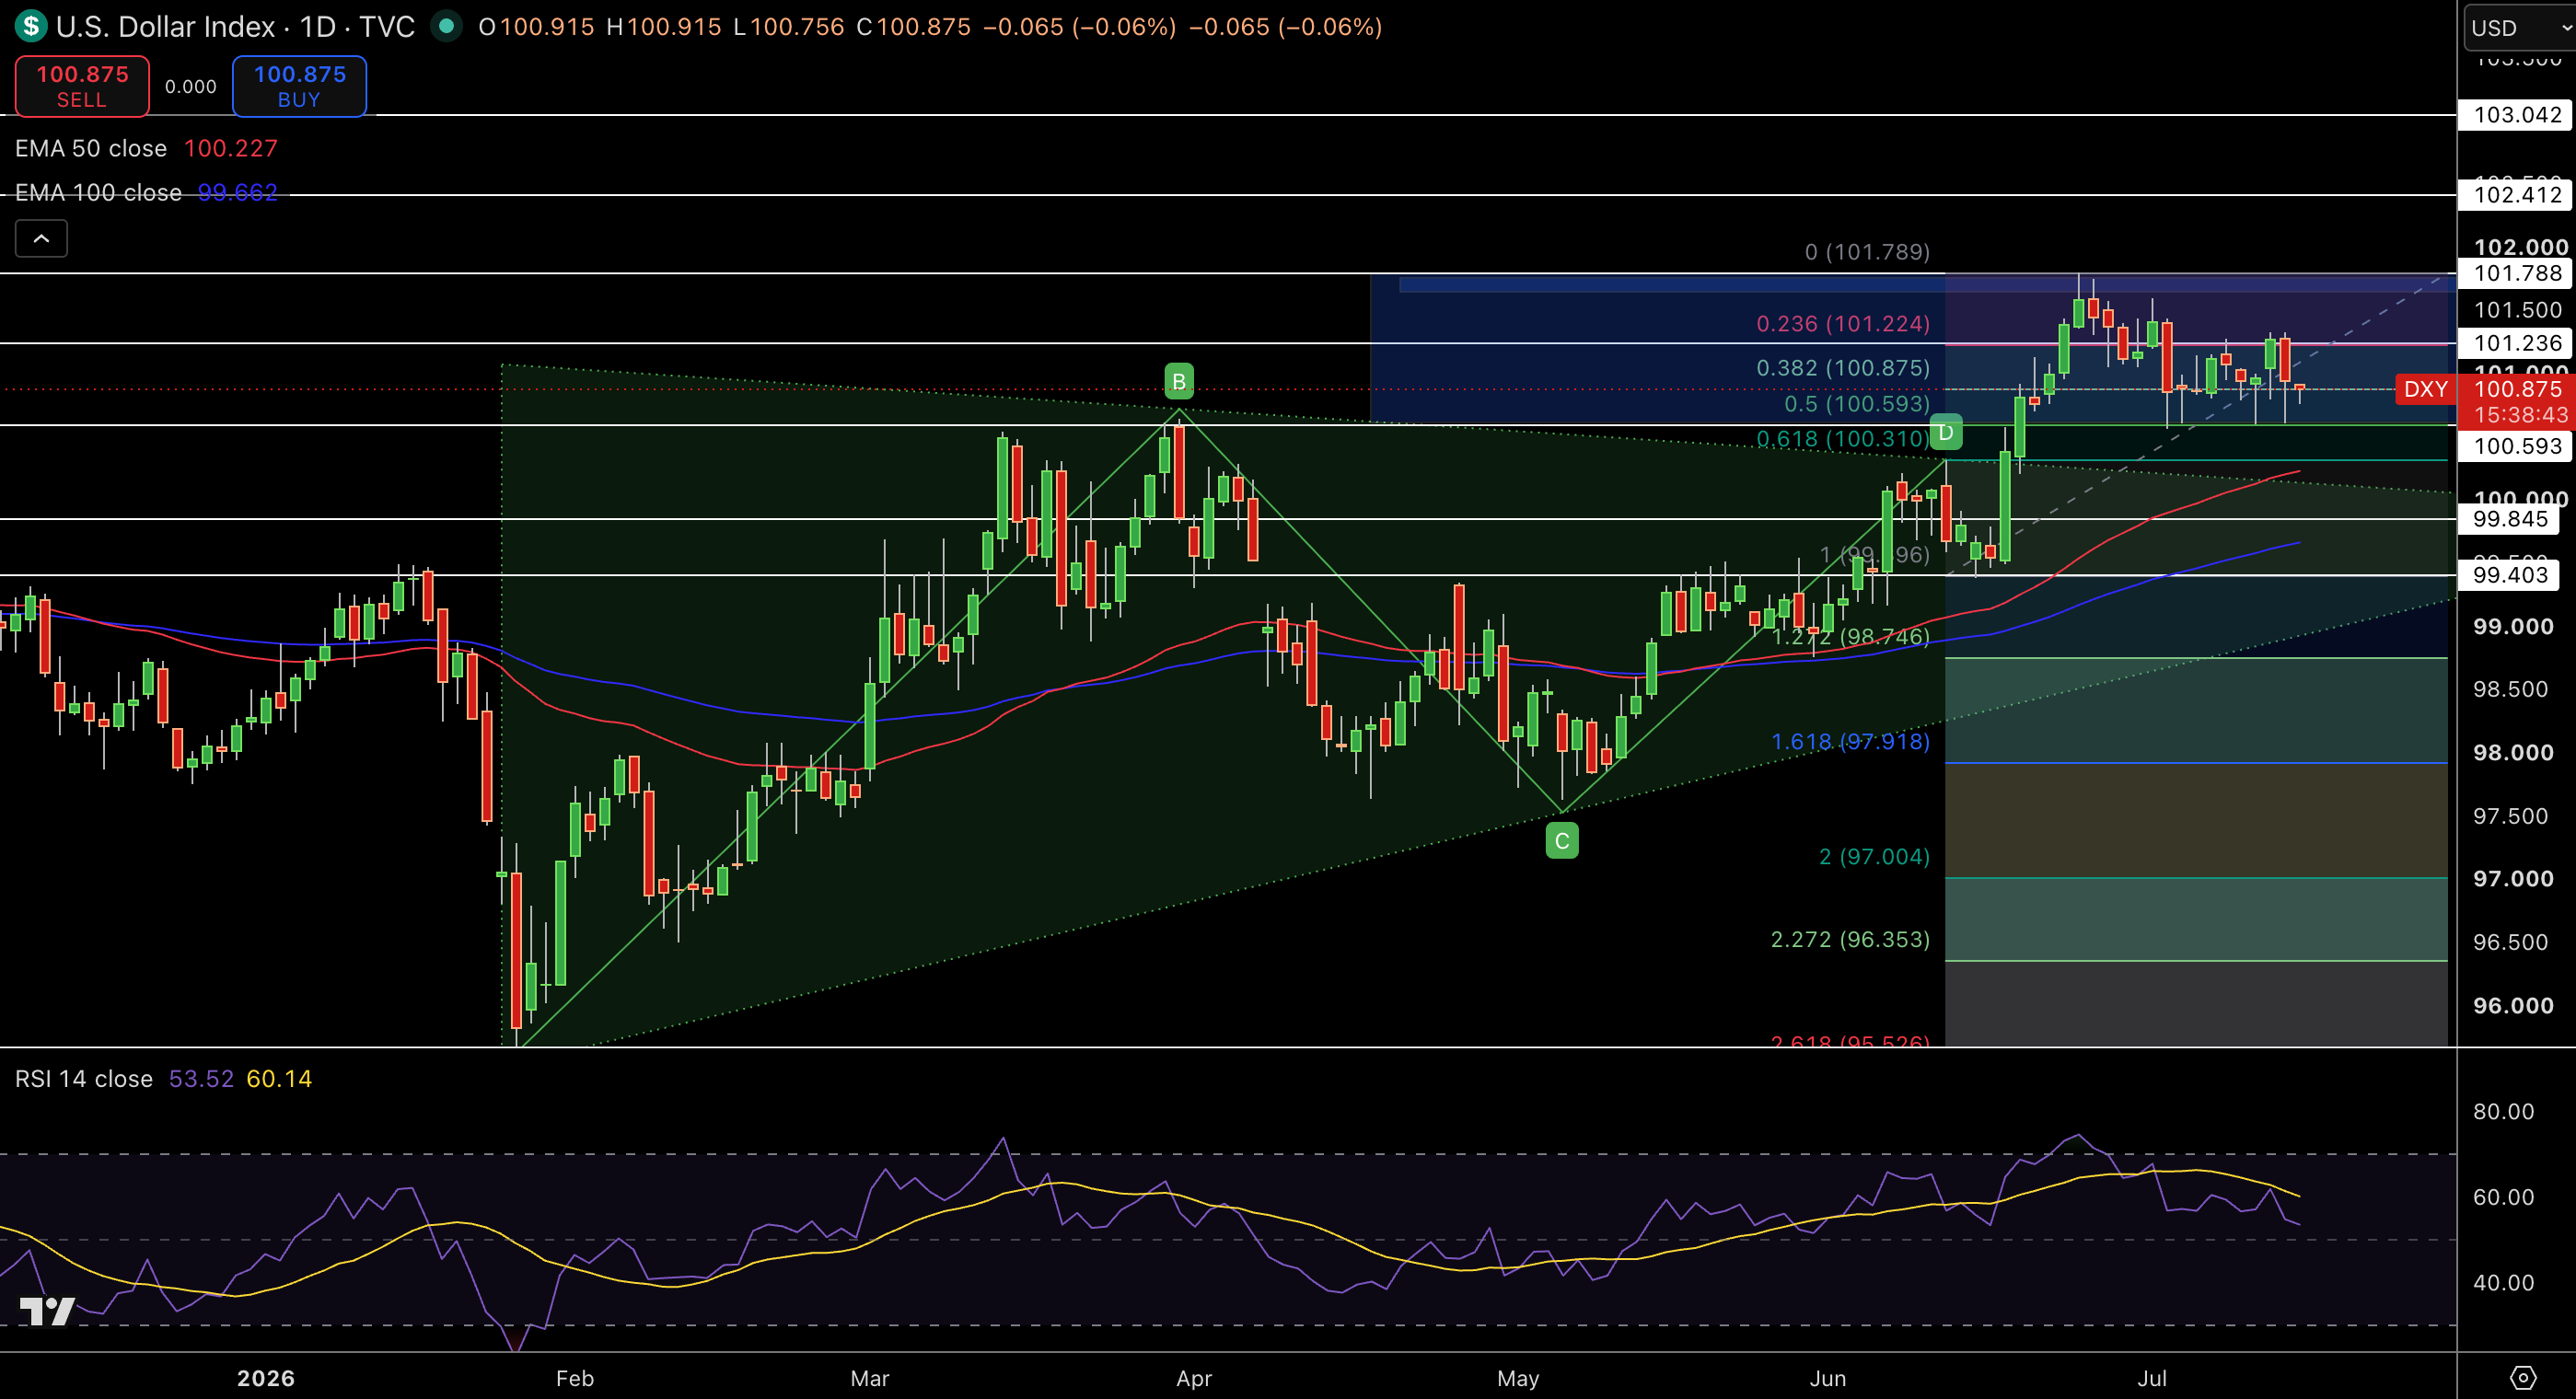
The US Dollar Index (DXY) is hovering around the 100.88 mark, consolidating above the 0.50 Fibonacci retracement at $100.59 and the 50 EMA at $100.23. The 100 EMA at $99.66 is helping the uptrend. The last few DXY candlesticks display small bodies showing consolidation below $101.22, right after the bullish breakout from the previous descending triangle. $100.88 is the 0.382 Fibonacci level and is providing immediate support, while resistance sits at $101.22 and $101.79 respectively.
The RSI is at approximately 53, above the midpoint, and is showing a decrease in bullish momentum, but the uptrend is still there. As long as we observe DXY above $100.59, we can expect another attempt to reach $101.22, but if that fails, we may see $99.85.
GBP/USD Technical Analysis: Can the Rising Channel Extend the Rally Above $1.3450?
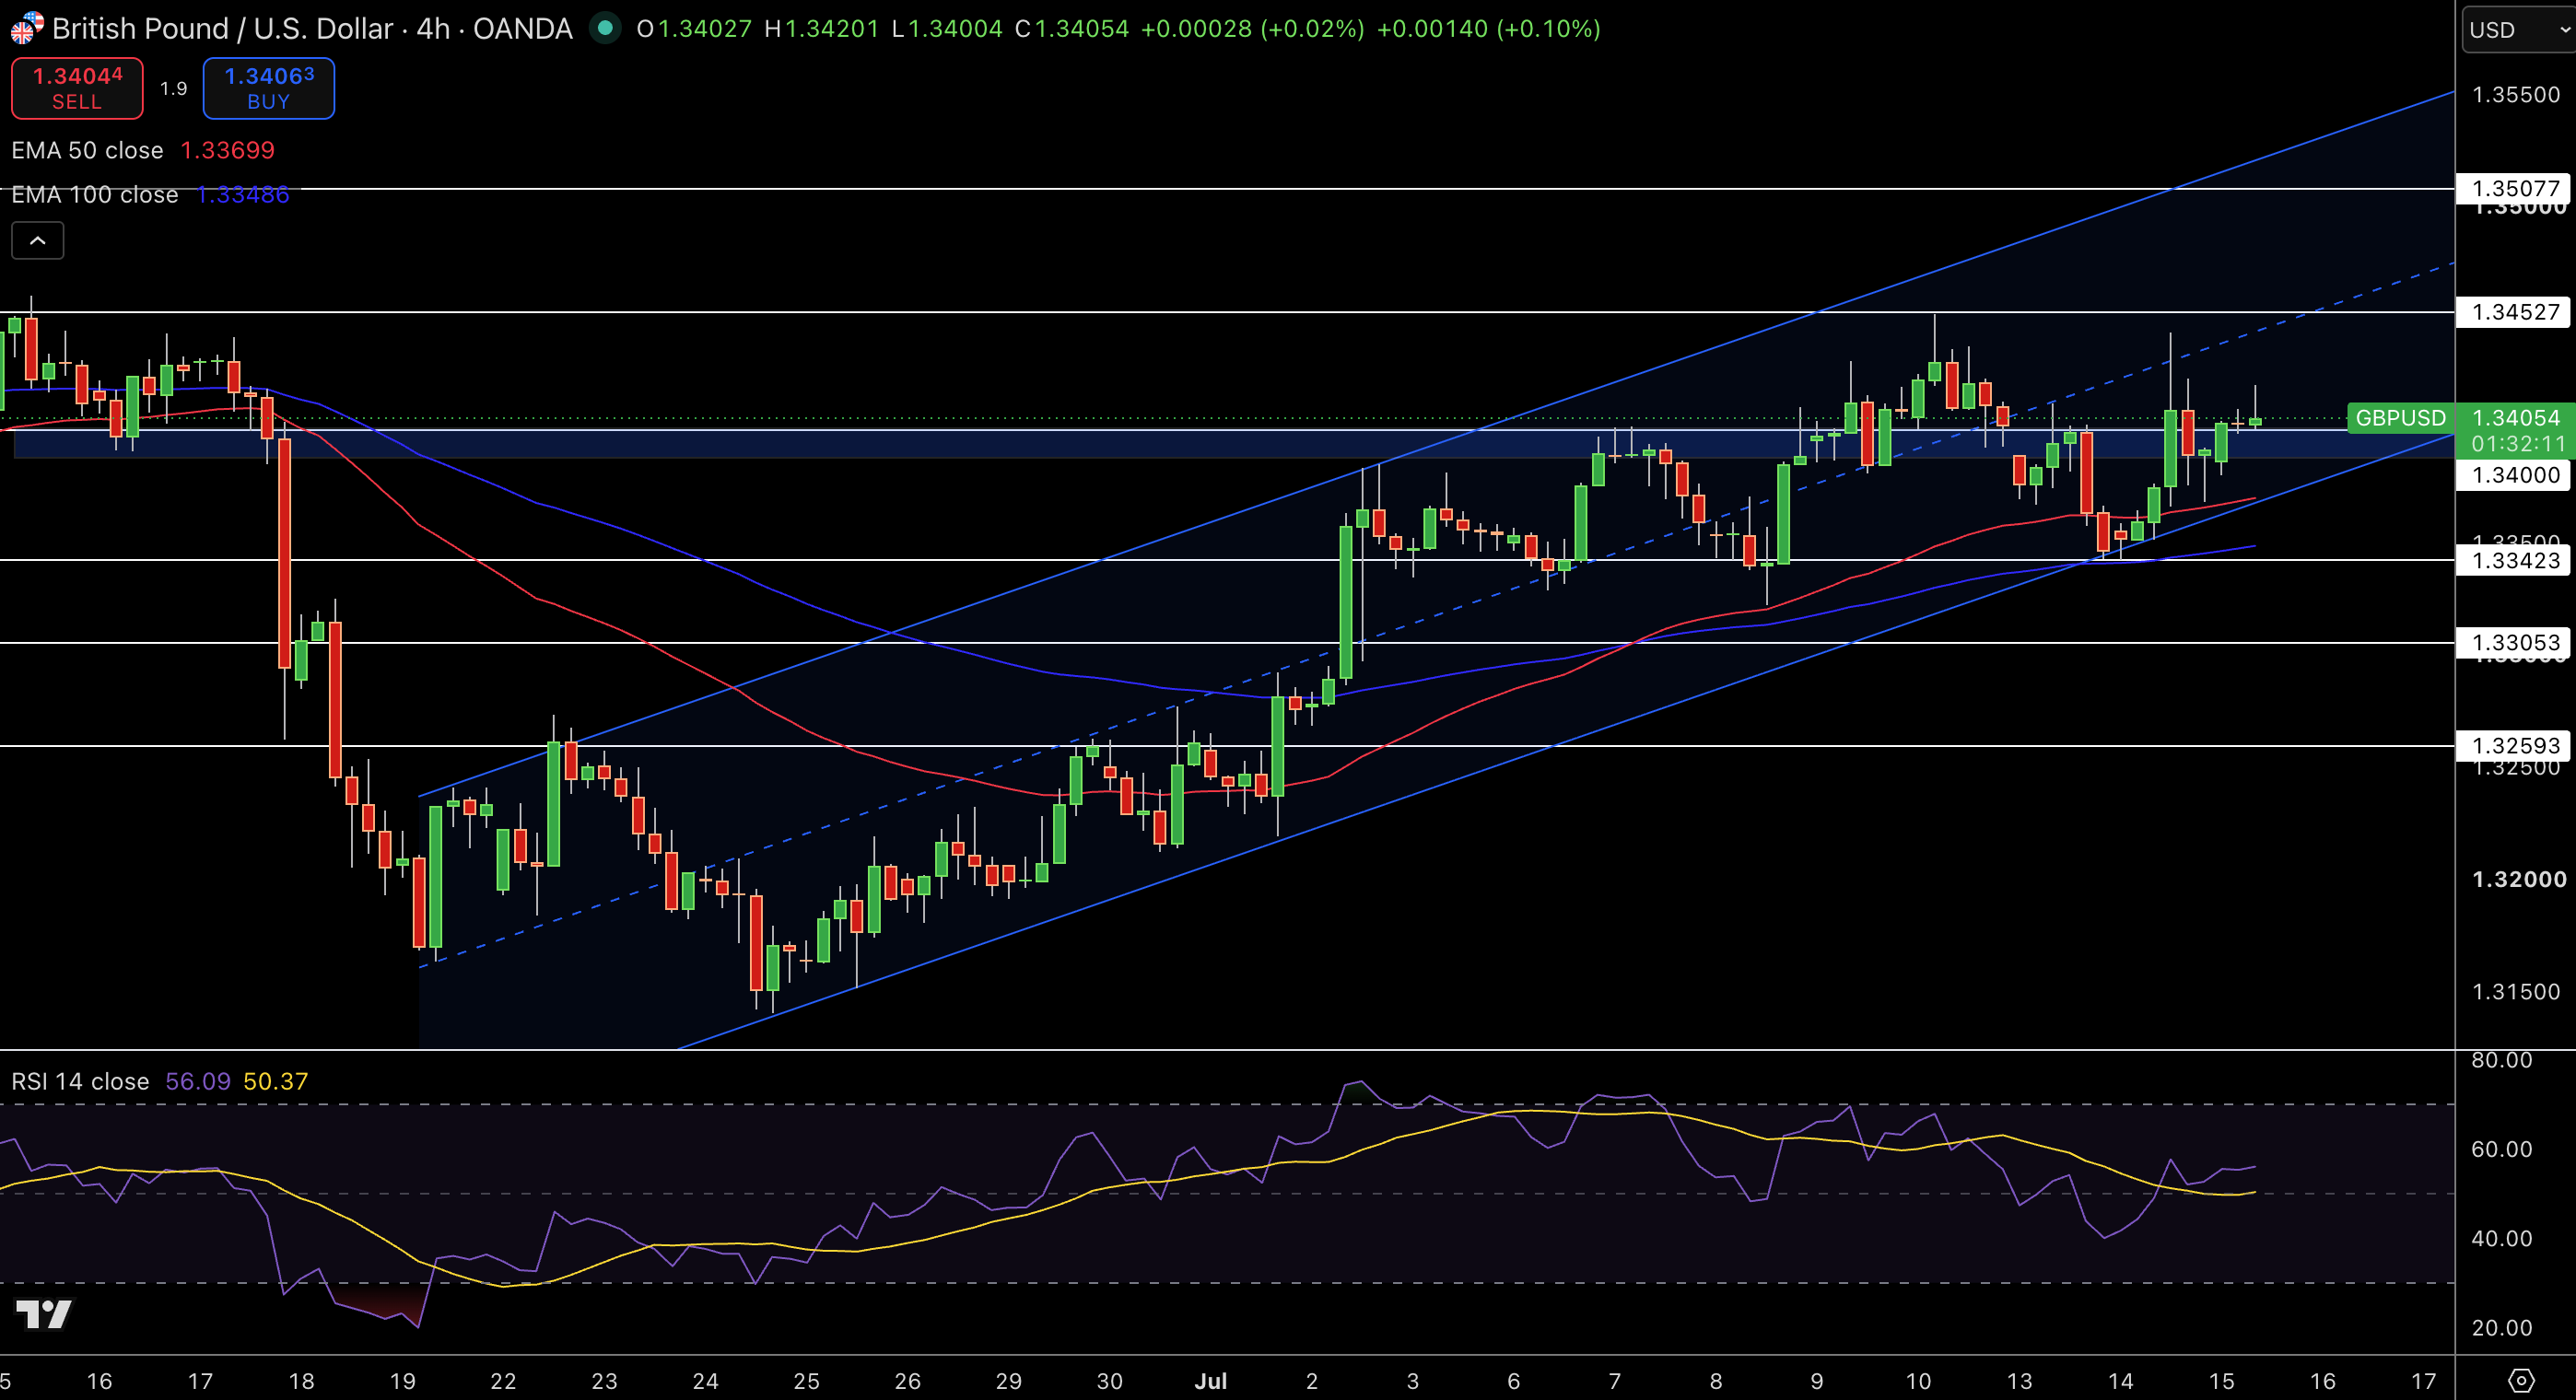
GBP/USD is currently trading around 1.3405 and stays well within the confines of a rising channel on the 4 hour time frame. Price is above both the 50 EMA at 1.3370 and the 100 EMA at 1.3340 indicates that traders are still dominating the buying side of the market. Recent rejections of the 1.3400 support level have resulted in the formation of higher lows along the rising channel line. The most immediate resistance is found at 1.3453, while 1.3508 is a secondary resistance level.
The most significant support level is at 1.3342. The RSI is at 56 and indicates a bullish market, while the RSI is not at the overbought zone. Based on this market analysis I will be looking for buying opportunities above the 1.3400 level, the target being 1.3453 and with a break below the 1.3342 level the buy side market structure will be broken and this will be an indication of potential reversal in the market.
GBP/USD Price Forecast
Every new GBP/USD analysis as it publishes, today's technical signal and key levels, live price — on one page.
See all GBP/USD forecastsEUR/USD Technical Analysis: Will the Symmetrical Triangle Trigger the Next Breakout?
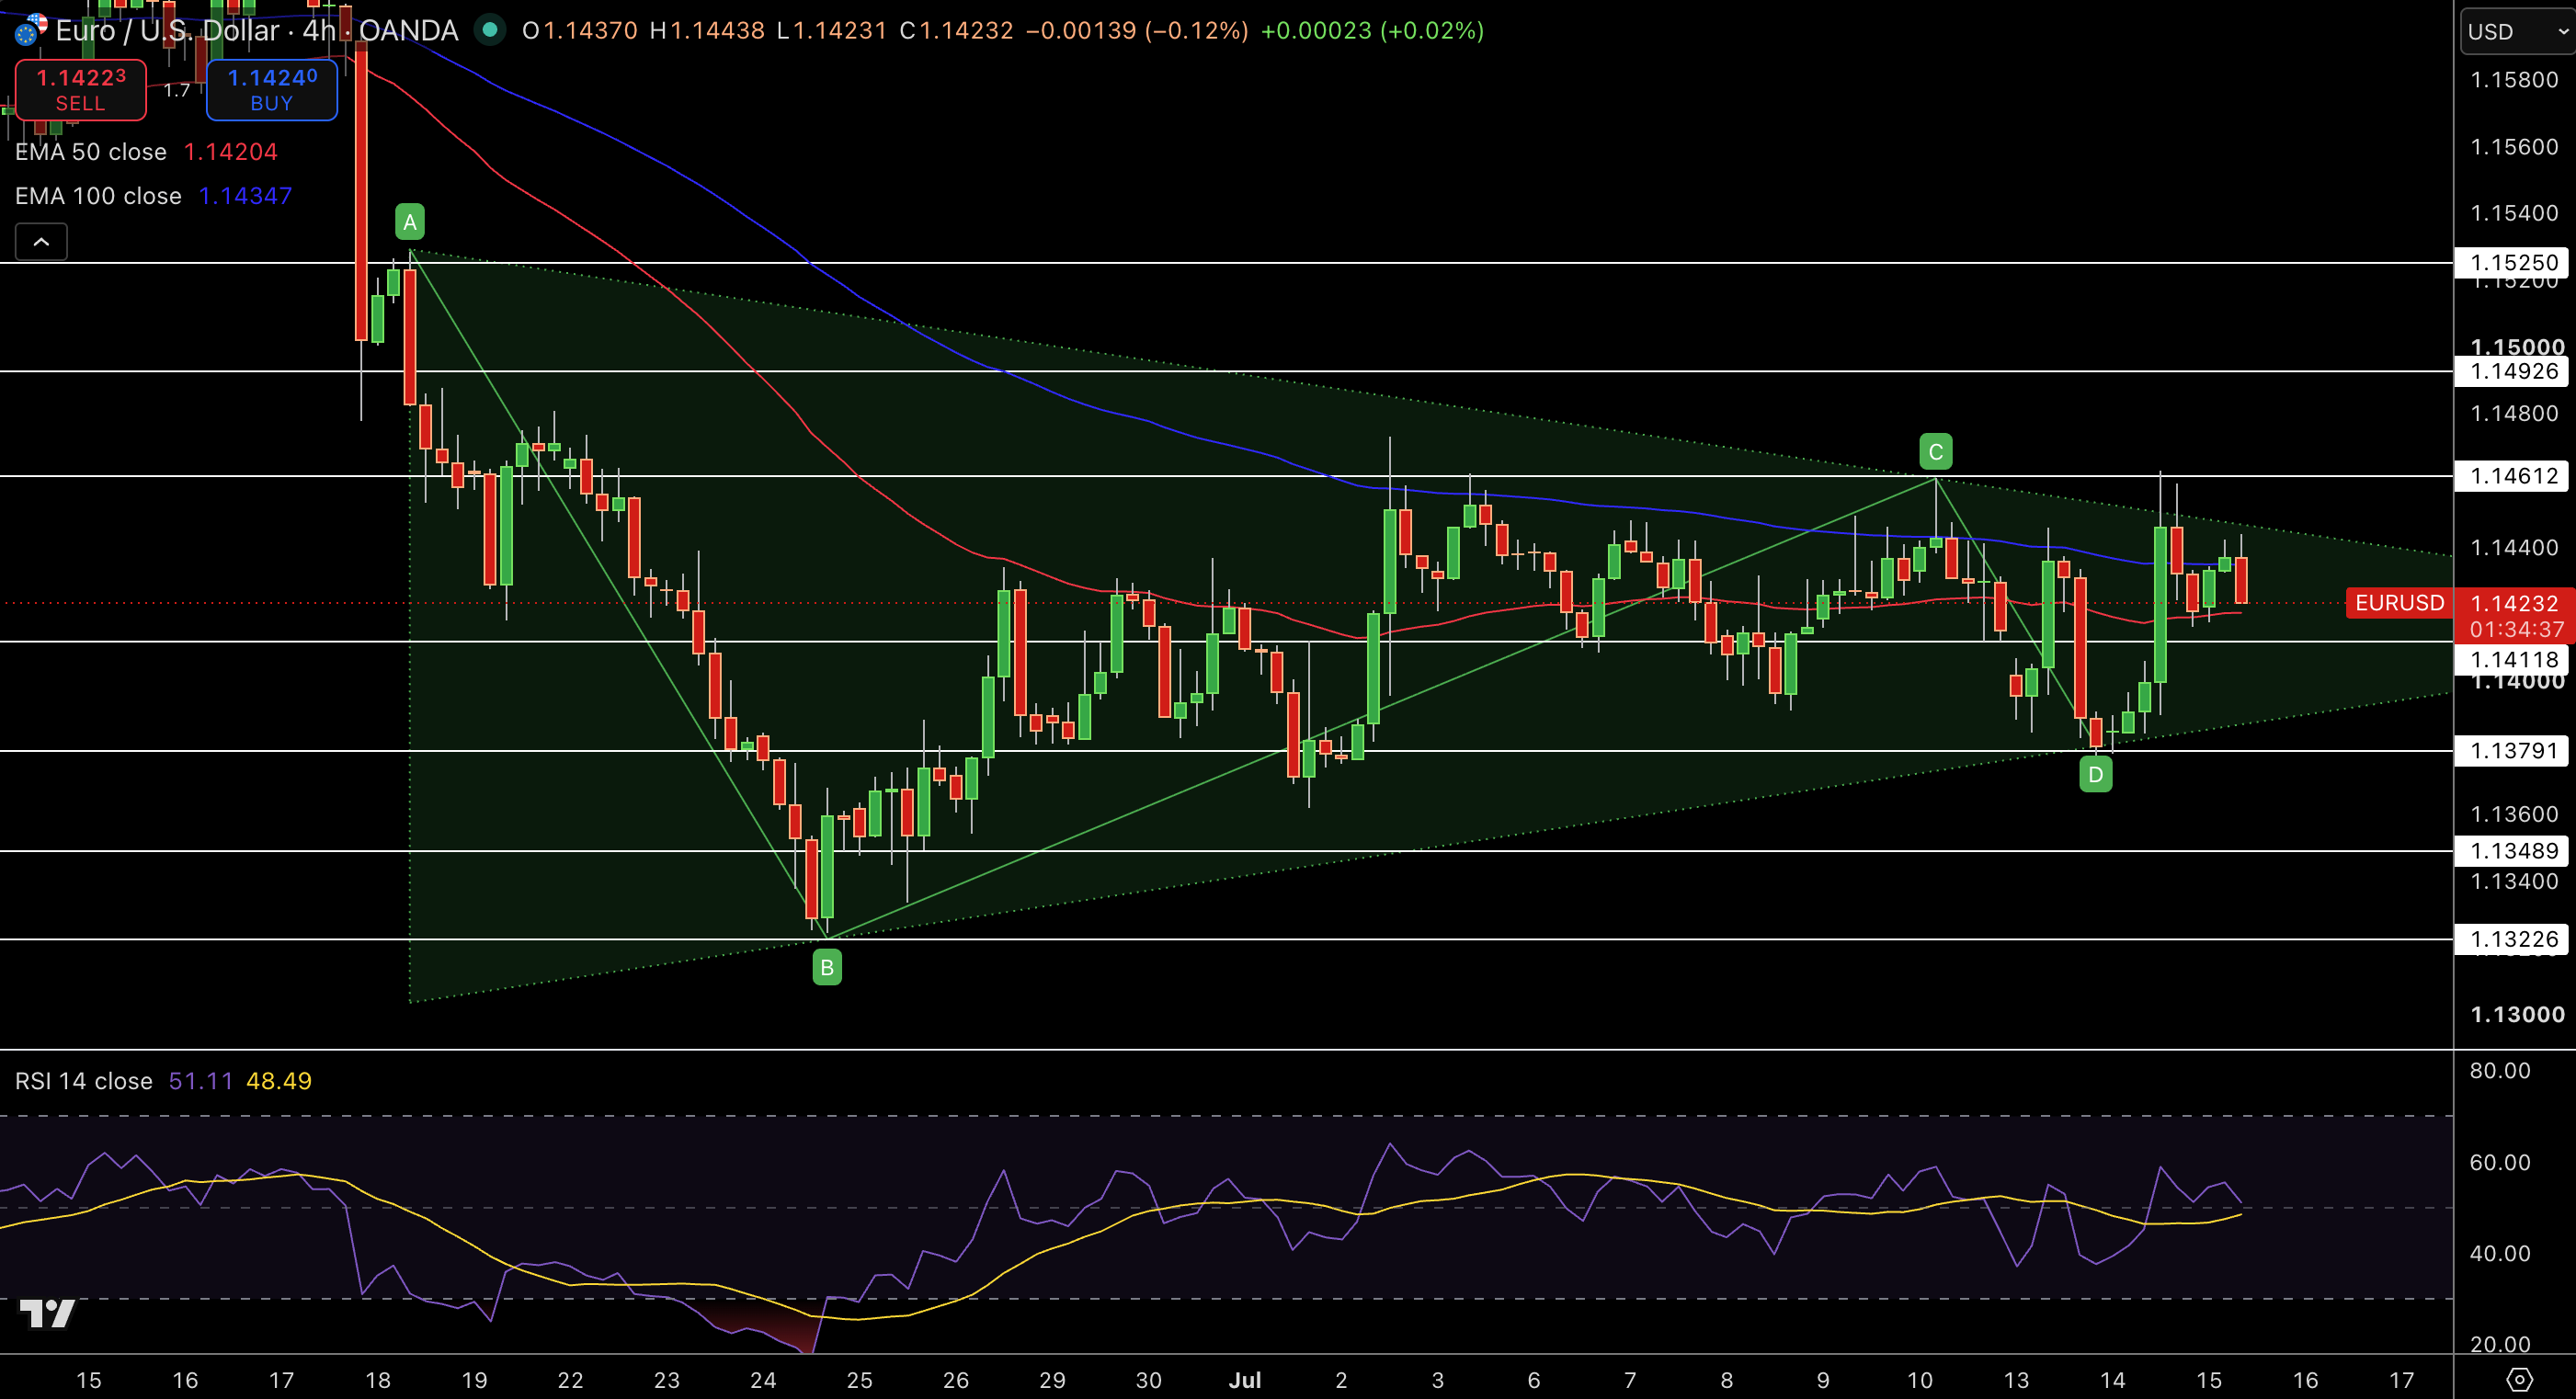
EUR/USD is priced at 1.1423 and is forming a symmetrical triangle on the 4-H chart. The price is around the 50 EMA at 1.1420 but is below the 100 EMA at 1.1435. This shows that buyers and sellers have not taken control of the market. The latest candlesticks show small bodies and long wicks suggesting indecision as the triangle’s apex is approached.
The first nearby resistance is at 1.1461, and the first nearby support is at 1.1412, then 1.1379. The RSI is at 51 and shows no market pressure, which supports consolidation. Given this analysis, I would prefer to see a confirmed breakout beyond 1.1461 with targets set at 1.1493. However, if the price closed below 1.1412, the target would be 1.1379.


