
Oil and Gas Fundamentals Reflect Supply Discipline and Seasonal Demand.
Oil markets as of July 10 show OPEC+ sticking to its commitments and production growth in other nations, especially the U.S. shale basins, continuing as refinery usage stays high due to summer driving demand and industrial consumption from petrochemical demand.
Oil inventories in key storage centers are slightly changing in sync with supply and offtake. U.S. crude oil inventories indicate limited net changes, with oil storage at most major storage centers hovering around the low end of normal ranges. U.S. gasoline and distillate inventory levels continue to hold as economic activity supports end-use demand.
U.S. dry natural gas production continues to reach record highs as it’s supplemented by higher associated gas from U.S. shale oil plays and more gas production from unconventional oil and gas wells. The U.S. is now exporting a large volume of liquefied natural gas (LNG) through a growing number of facilities. U.S. natural gas inventories continue to grow during the injection season, with working gas levels positioned above historical averages. U.S. power sector consumption varies with weather conditions, while industrial demand is consistent, indicating the U.S. is well-supplied both domestically and for exports.

Natural Gas Price Forecast: Oversold RSI Supports Recovery From $3.00
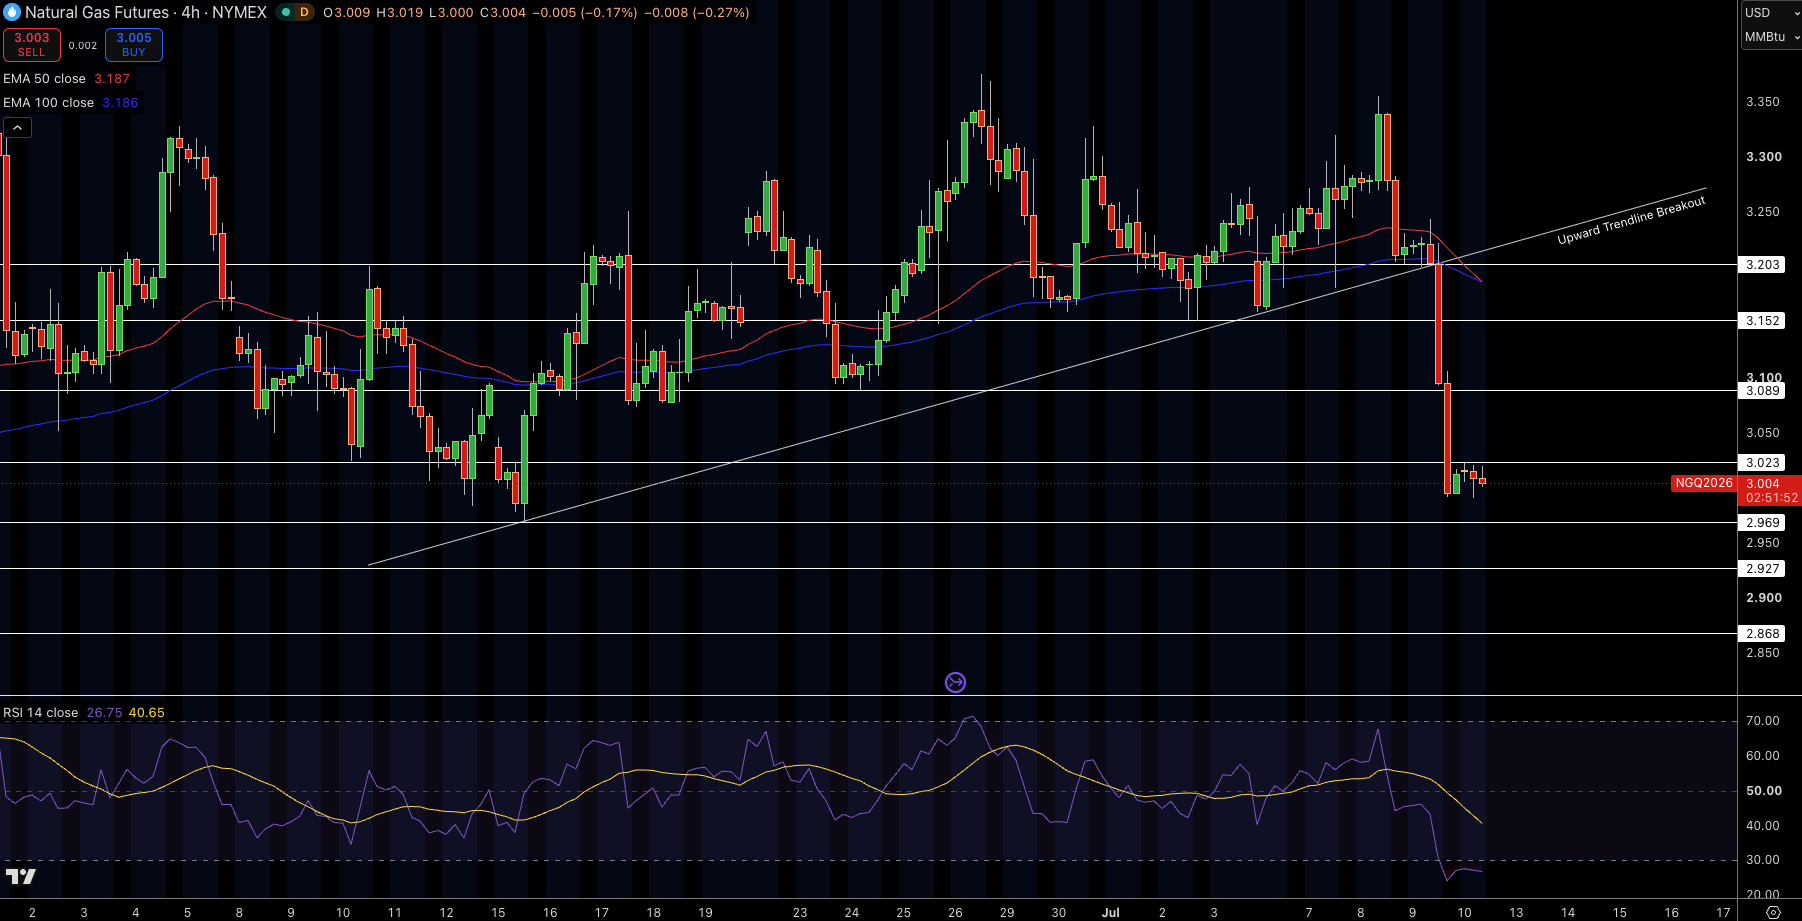
Natural gas prices have recovered from the psychological mark of $3.00 to trade at $3.008 on the 4-Hour NYMEX chart. Higher lows have formed following a break in the downward trend, suggesting that bulls are gaining momentum again after price fell from $3.377.
With RSI at 27, the asset is in oversold territory which increases the odds of a short-term relief rally. The Volume Profile highlights $3.00 to $3.12 as a key volume node where buyers are currently positioned, and they may continue to defend this area.
However, Natural Gas will face stiff resistance at the EMA50 at $3.187, which is the first major hurdle for any further move up. If price remains above $3.00, the market could continue to trend up toward $3.20. Any failure to maintain support at $3.00 will invalidate the bullish setup.
Trade Idea: Buy at $3.008, Target $3.20, Stop $2.97
Natural Gas Price Forecast
Every new Natural Gas analysis as it publishes, today's technical signal and key levels, live price — on one page.
See all Natural Gas forecastsWTI Crude Oil Price Forecast: Bearish Structure Keeps Focus on $66.83
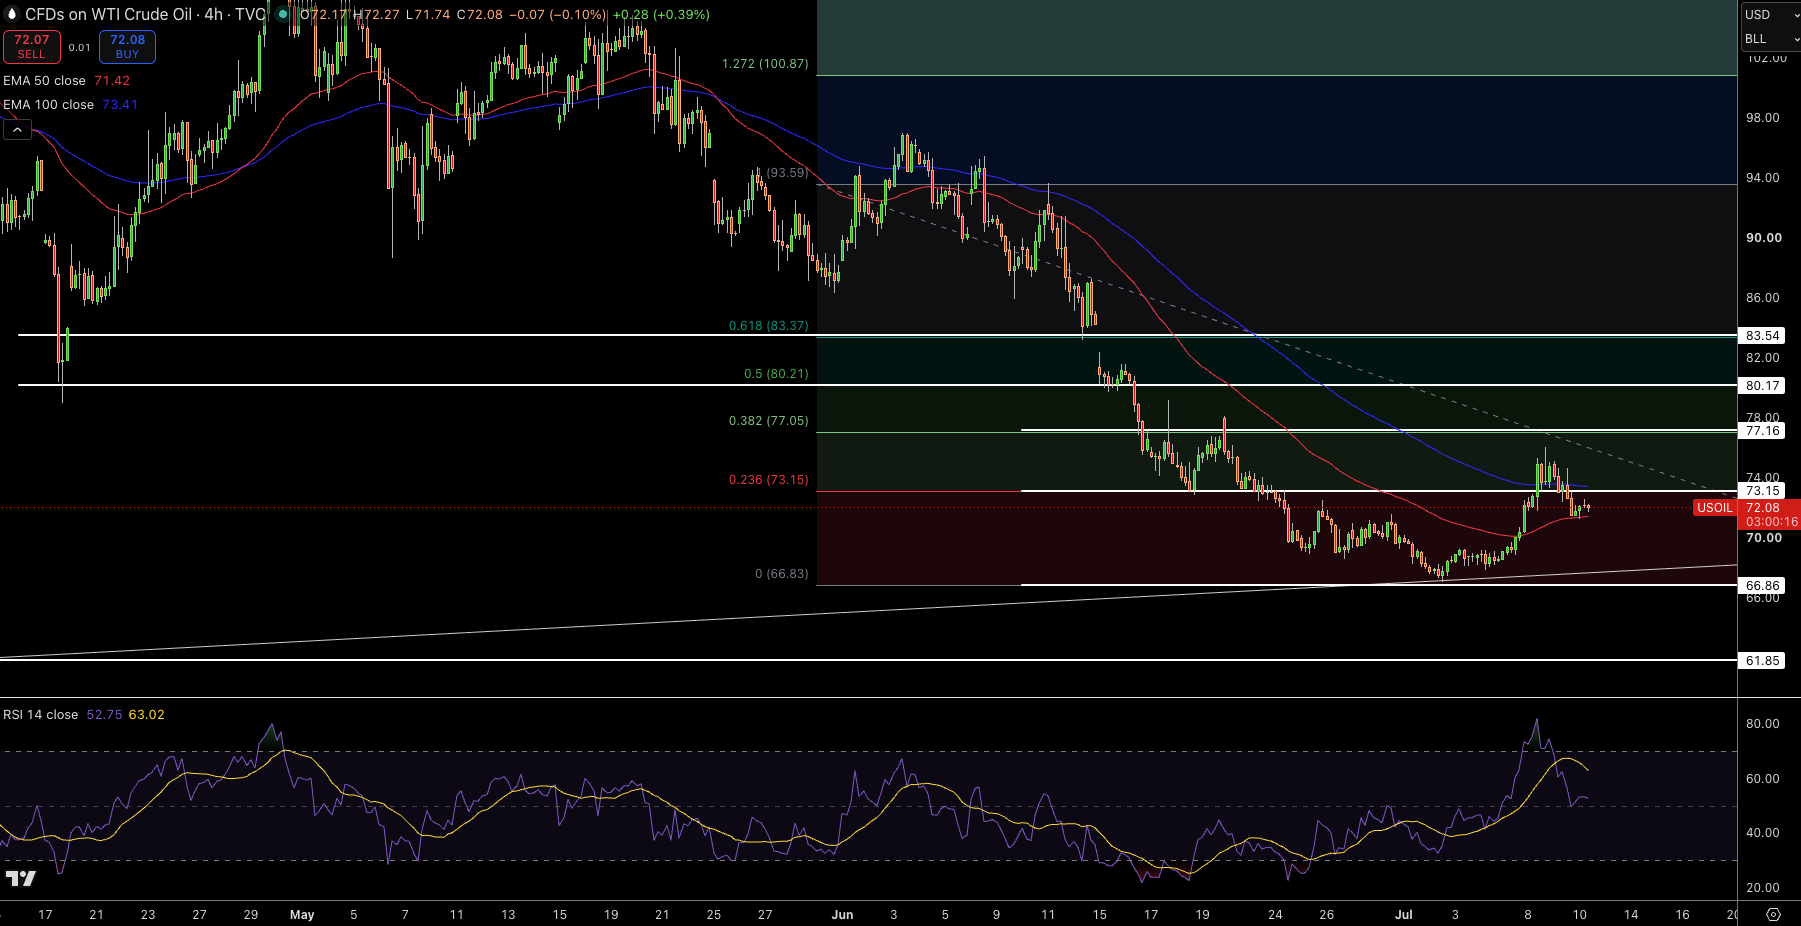
The 4-Hour chart currently puts WTI crude at $72.08. We are finding it difficult to regain traction after the major pullback from the $93.59 swing top. While the price tested the 23.6% Fib level at $73.15, indecisive candles and the subsequent rejections at that level demonstrate that the selling remains in force. Despite the short-term EMA50 at $71.42 still acting as support, a series of lower highs are visible and the price has been restricted from rising any higher in the medium-term.
RSI at 53 shows neutral momentum and no extreme overbought or oversold. The volume profile indicates a substantial supply cluster from $73.15 to $77.05 that continues to be used by the bears as a selling area. If price needs to move above that zone for a bullish technical setup, we have resistance levels waiting at $80.21 and $83.37. As long as the price stays below $77.16 the price is in a bearish setup and can potentially make another move down to $66.83 from here.
Trade Idea: Sell at $72.08, Target $66.83, Stop $73.15
Brent Crude Oil Price Forecast: Buyers Defend EMA Support Near $76
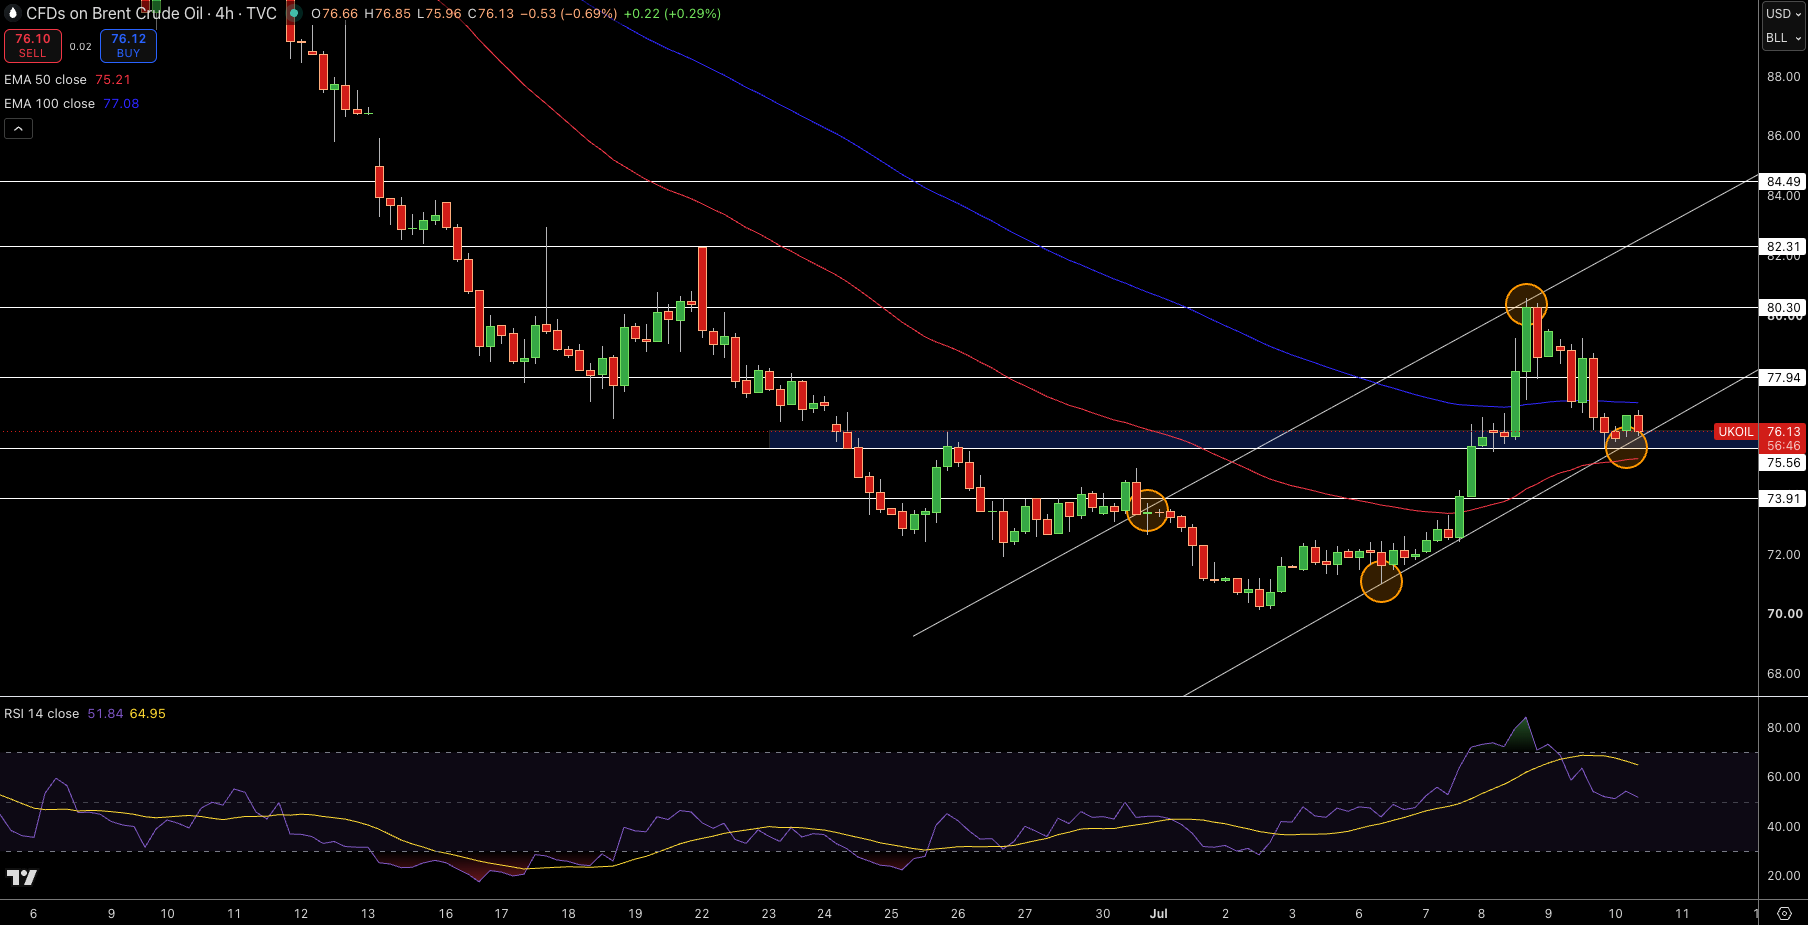
Brent crude oil sits at $76.13 on the 4-Hour chart, having managed to hold support near the EMA50 at $75.21. The latest candles have long lower shadows showing some attempts by buyers to support the price after the recent decline, but the EMA100 at $77.08 continues to cap upside.
The RSI at 52 suggests neutral momentum though it points to the current $76.00 to $77.00 region being a fair value area for buyers. We also see a number of higher lows forming in the price, meaning the EMA50 at $75.21 continues to be active. If buyers can continue to defend that level in the short-term we could see a run to the next major level at $77.94 before any resistance areas at $80.30. We will need to see a clear breakdown below the EMA50 for this leg to be invalidated.
Trade Idea: Buy at $76.13, Target $77.94, Stop $75.21