



Silver Loses the Week to September Hike Odds
Spot Silver (XAGUSD) is trading $60.07, up $0.10 or +0.17% at 07:16 GMT on Friday. Last week’s close was $62.40 and the metal has given back $2.33 since then. September rate hike odds near 63% are doing the damage, holding Treasury yields up and keeping the dollar firm. Silver is not winning that fight.

FOMC Minutes Handed the Bears Their Case
The June FOMC minutes split the committee down the middle. Roughly half the members projected another rate increase while the other half wanted to hold. That does not sound decisive until you look at where the market priced it.
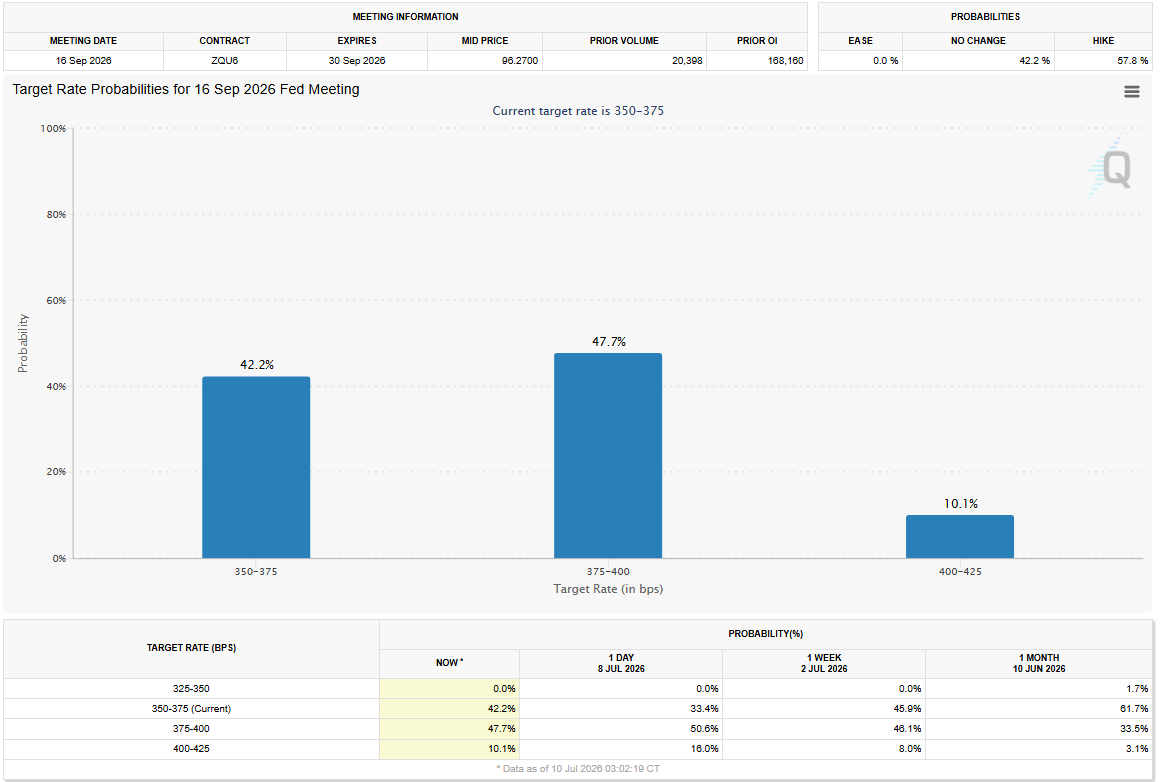
CME FedWatch puts the July 28-29 hold probability around 70% to 76%, but the September 25-basis-point hike probability climbed to 63% to 65%. By December, futures are pricing an 85% chance that at least one more hike gets delivered before year-end.
Geopolitical tensions in the Gulf are keeping inflation concerns alive and silver traders already know where that leads. Treasury yields are not coming down in that environment and neither is the dollar. The only thing keeping spot silver from testing new lows is the fact that half the committee did not call for another hike.
Silver Price Forecast
Every new Silver analysis as it publishes, today's technical signal and key levels, live price — on one page.
See all Silver forecastsCPI Decides Whether September Is Real
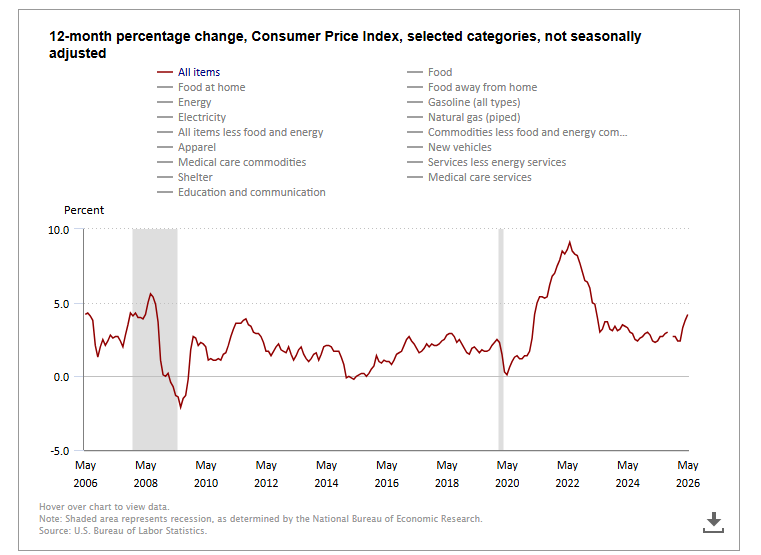
Next week’s Consumer Price Index report is the one number that can move those September odds. A reading that confirms inflation is still running hot gives Treasury yields and the dollar another leg. Silver does not want that fight. The trade only breaks if CPI comes in soft enough to pull September pricing back toward a hold. Short sellers are leaning into the hike bet and a miss forces covering. Silver’s first rally does not need fresh buyers. It just needs the rate trade to flinch.
Daily Spot Silver (XAGUSD) Technical Analysis
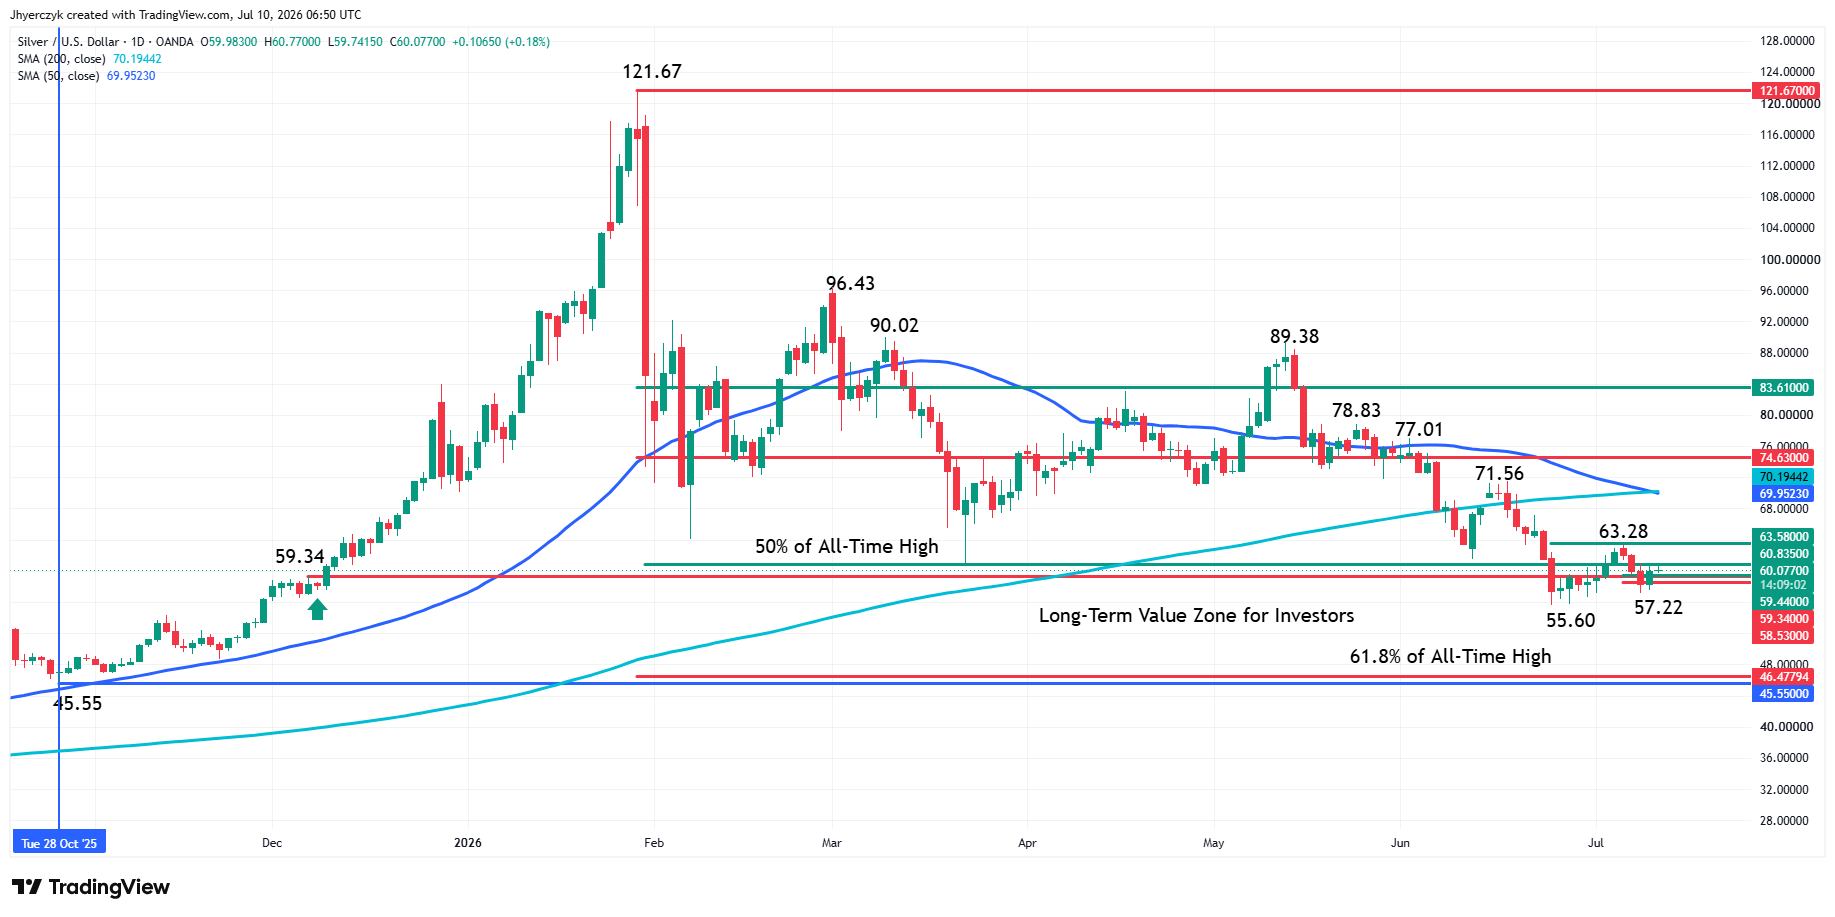
Spot Silver is edging higher overnight as bullish traders attempt to build a secondary higher bottom that could lead to a near-term change in trend and a possible test of the 50-day and 200-day moving averages if the right catalyst emerges. All of this is taking place around a long-term 50% level and at the top of a major value zone. In other words, this doesn’t appear to be random buying but the start of a long-term campaign. Now nothing works 100% of the time so there are risks, but so far the short-term structure looks impressive although I’m disappointed with the volume, which is often the reason why these chart patterns fail.
There is nothing too complicated about the chart pattern. In fact, it’s all about tops, bottoms and retracement zones. Moving averages and oscillators aren’t even coming into play.
The long-term range is $0.00 to $121.67. 50% of the all-time range is $60.835. 61.8% of the all-time range is $46.48. The retracement levels form our long-term value zone. It’s funny how many traders are out there monitoring the price action about a 50% level on the hourly chart, when the trading god’s have presented us with 50% to 61.8% of the all-time range.
Let’s assume that aggressive counter-trend buyers stopped the selling at $55.60 on June 24. The buying volume may have been strong enough to trigger a short-covering rally to $63.28. The first leg up from every major bottom is primarily driven by short-covering. It’s what happens on the next leg down that usually determines what the next major move will be.
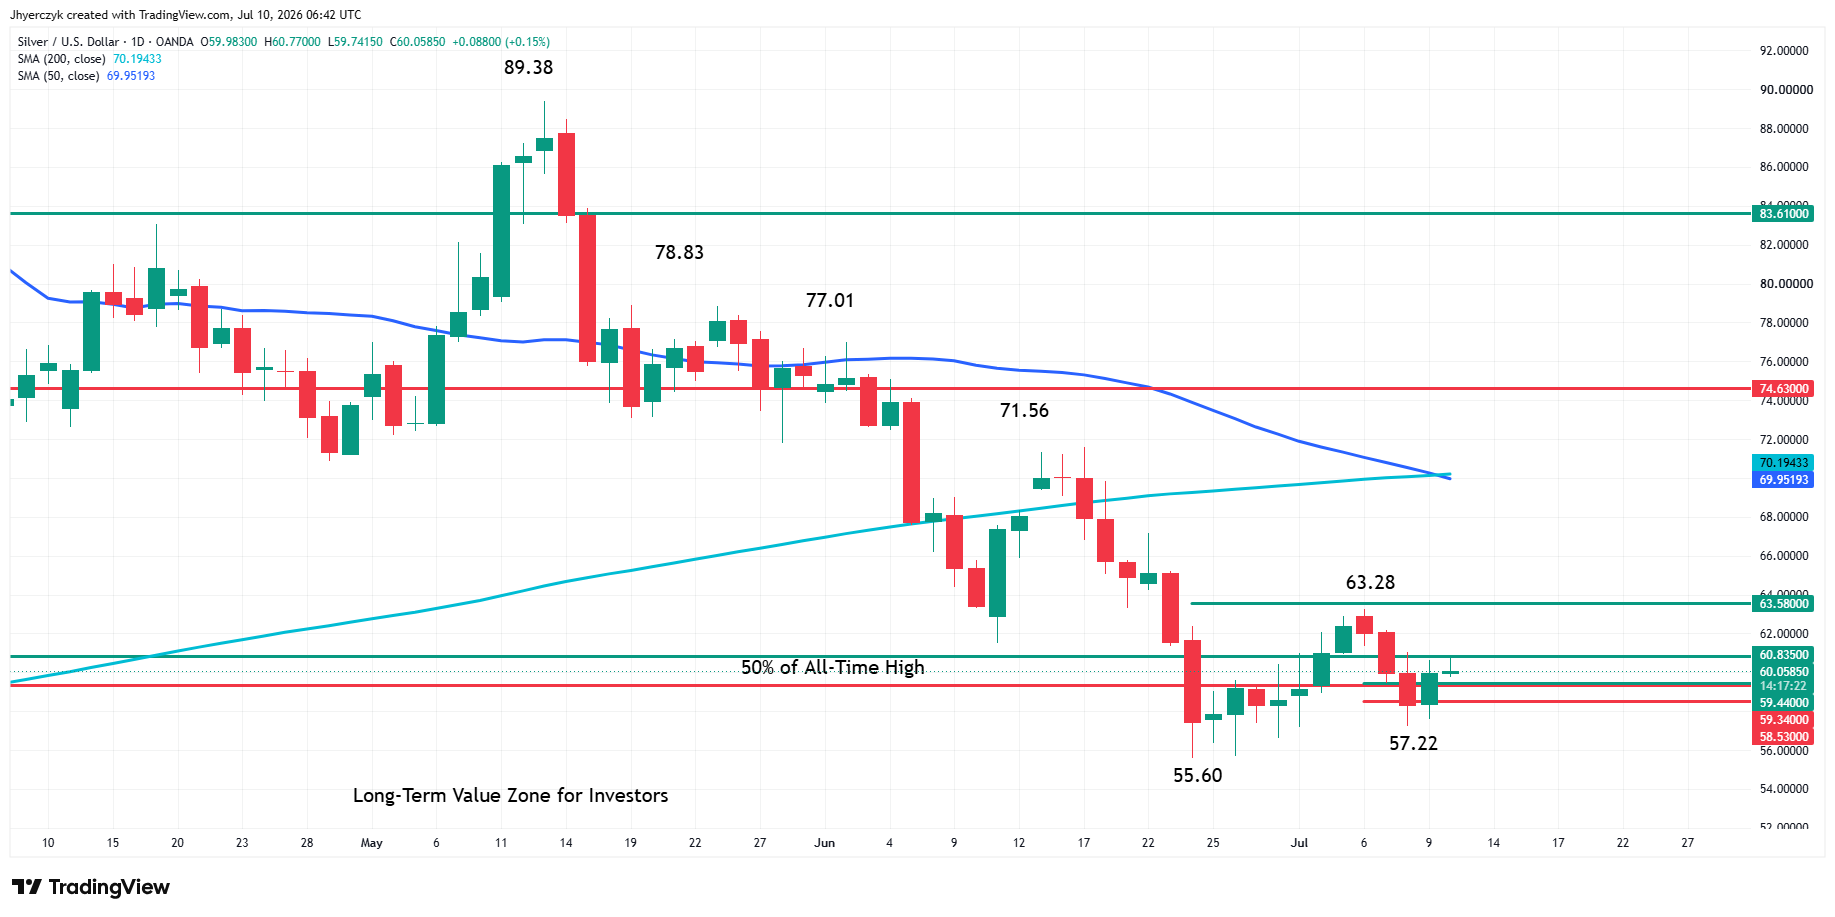
Let’s dial it back a notch and talk about the trend. The trend is down according to my swing chart and the moving averages so traders are still in “sell the rally” mode. The last completed swing down was $71.56 to $55.60. The rally to $63.28 stopped just short of its 50% level at $63.58. Three days of selling pressure this week turned $63.28 into a new swing top.
The last completed swing up is $55.60 to $63.28. Its retracement zone at $59.44 to $58.53 is currently being tested. This is our battle ground. Aggressive counter-trend traders may be trying to establish a secondary higher bottom inside this zone. They aren’t trying to pick a bottom. They are trying to establish a new long position because they have a lean or an exit under $55.60, in case they are wrong. At the same time, aggressive trend traders are trying to overcome the buyers and push the market lower in an effort to continue the downtrend under the swing bottom at $55.60.
Our entire focus on Friday will be on the price action and order flow around $59.44 to $58.53. It is going to tell us if the buyers or sellers are winning the battle. If the buyers come out ahead then look for new money and shorts to push the market higher through 50% of the all-time high at $60.83, and eventually the swing top at $63.28 and the 50% level at $63.58. If successful, this could create the upside momentum needed to challenge the 50-day MA at $69.95 and the 200-day MA at $70.19.
The bullish scenario will likely fail if sellers regain control and drive the market through $57.22. In this case, momentum will increase to the downside and $55.60 will hit the radar.
The key is the volume. Trend traders don’t really need big volume to continue the move, but counter-trend buyers do.
What to Watch
The July 28-29 FOMC meeting is still three weeks away and the market has already priced in a hold. The real fight is September and next week’s CPI is going to tell traders whether the hike probability is justified or overcooked. Treasury yields and the dollar are not coming down unless the inflation data give the committee a reason to stand pat. The rate trade is running silver right now and the bulls are waiting for a catalyst that has not shown up.
The retracement zone at $59.44 to $58.53 is the battleground. A higher bottom inside that zone keeps the door open to the all-time 50% level at $60.83 and eventually the swing top at $63.28. Losing $57.22 breaks the structure and puts $55.60 back in play.
More Information in our Economic Calendar.



