
Currencies Reflect Divergent Monetary Policies and Economic Fundamentals
The dollar, euro, and pound have maintained their distinct courses as of July 10, with each currency being driven by different central bank strategies as well as a variety of local economic fundamentals. In the US, core inflation has remained high, prompting the Federal Reserve to maintain the relatively restrictive monetary policy outlook which has supported the dollar’s value. Additionally, the dollar has a lot of fundamentals supporting it, such as US domestic demand and the greenback’s status as the dominant reserve currency.
The euro has also been struggling to navigate mixed economic activity throughout the Eurozone, and in addition, the ECB is trying to achieve price stability. As countries continue to have varying fiscal positions and inflation rates, they are impacting the way that monetary policy affects each country differently. For the euro, that translates into being vulnerable to data releases on economic activity and wage increases.
Sterling faces the same challenge of balancing between the Bank of England’s concerns over services inflation and the economy’s slowing pace. In the UK, there continues to be domestic fiscal policy and labor markets that will remain important factors in the pound’s performance. On top of that, policy decisions of the other two central banks will impact the currency pair prices.
These currencies’ fundamentals reflect that their divergence is going to remain intact for some time to come. Inflation levels, fiscal policy choices, and economic growth vary from country to country in terms of pace and resilience. As a result, two-way risks remain prevalent in these currencies and will persist. These countries’ differences will play out in the currencies’ trade balances and capital movements, in addition to the central banks’ capabilities to stabilize growth.

DXY Holds $100.79 – Fibonacci 0.618 Retest on 4h
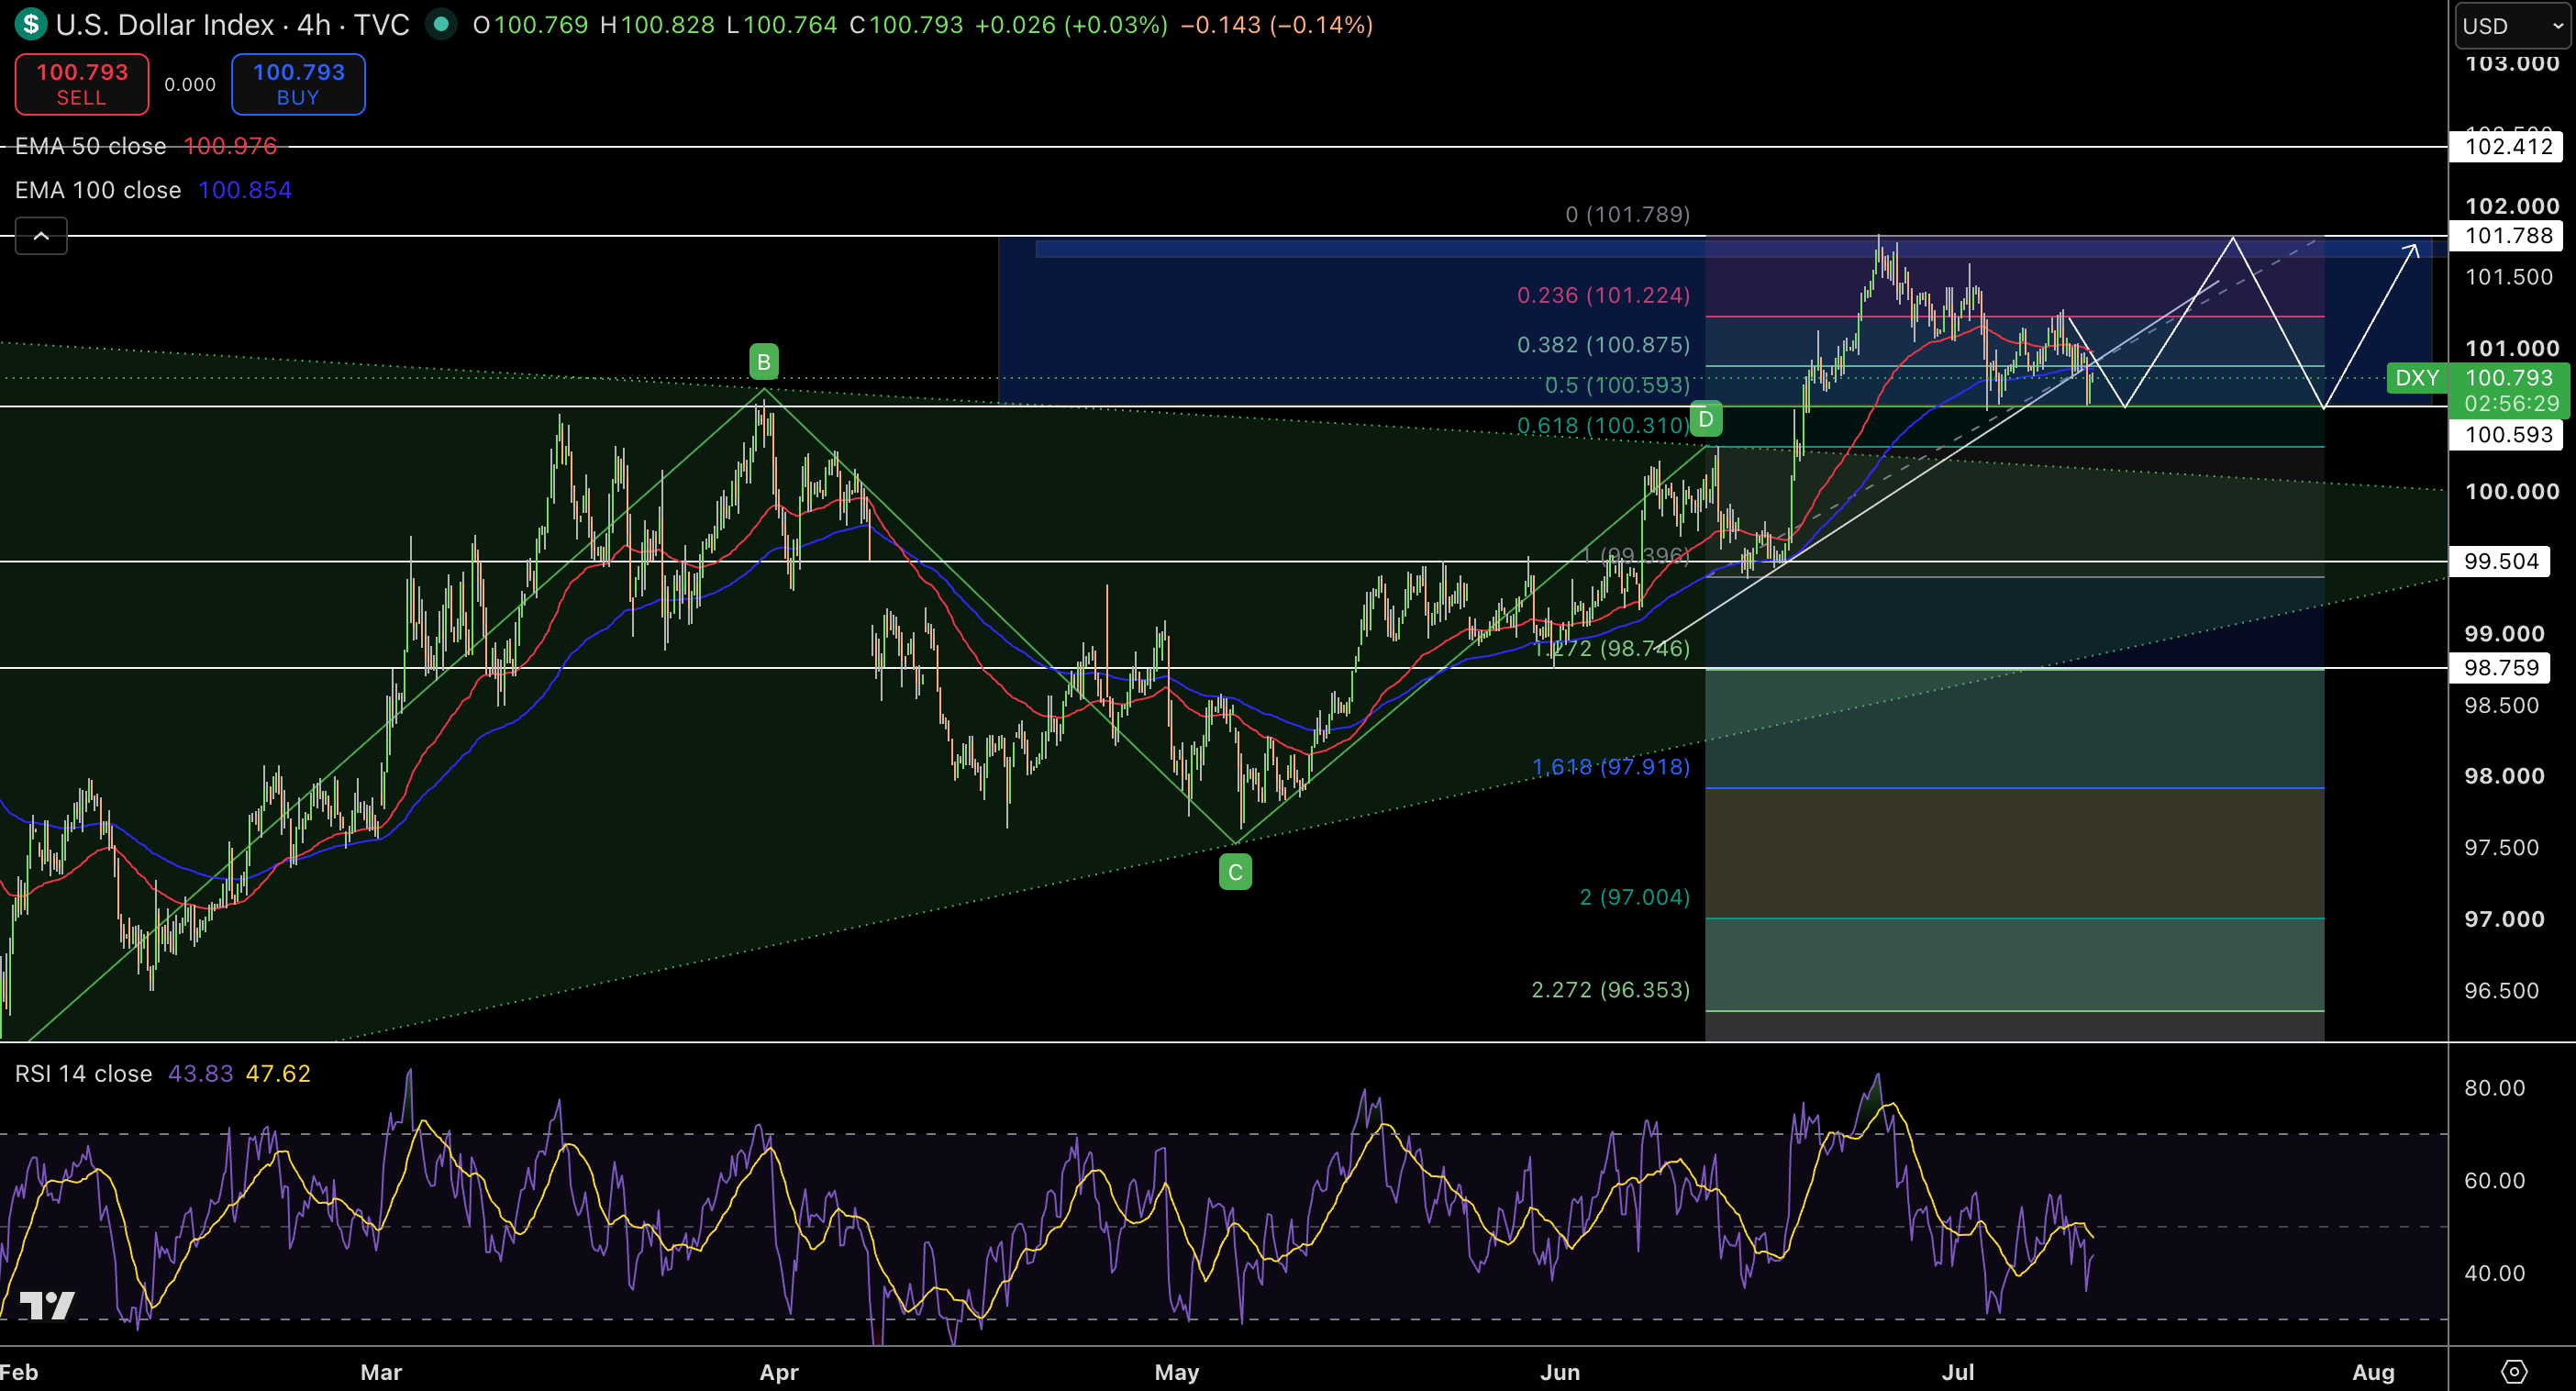
DXY trades at $100.79 on the 4-hour chart, with alternating green and red candles testing the 0.618 Fibonacci retrace close to $100.31, prior to a sharp rebound from the $97.67 swing low. The presence of green candles with successive higher highs points to a clear bullish trend in the hands of the buyers who are respecting the 50-period exponential moving average (EMA) close to $101.02. The Relative Strength Index (RSI) is trading near 44 and is currently sitting in neutral territory.
Volume profile shows $100.59 to $101.06 as a strong breakout pivot area. Fibonacci projects the next bullish price level around $103.09 in the coming few weeks. The trend remains bullish on the 4-hour timeframe, as long as DXY holds above the $100.59 zone in a clear ascending channel. The uptrend is characterized by higher highs and higher lows, with buyers firmly in control.
Trade Idea: Buy $100.79, target $103.09, with a stop at $100.59.
GBP/USD Price Forecast
Every new GBP/USD analysis as it publishes, today's technical signal and key levels, live price — on one page.
See all GBP/USD forecastsGBP/USD Holds $1.3422 – EMA 50 Defense on 4h
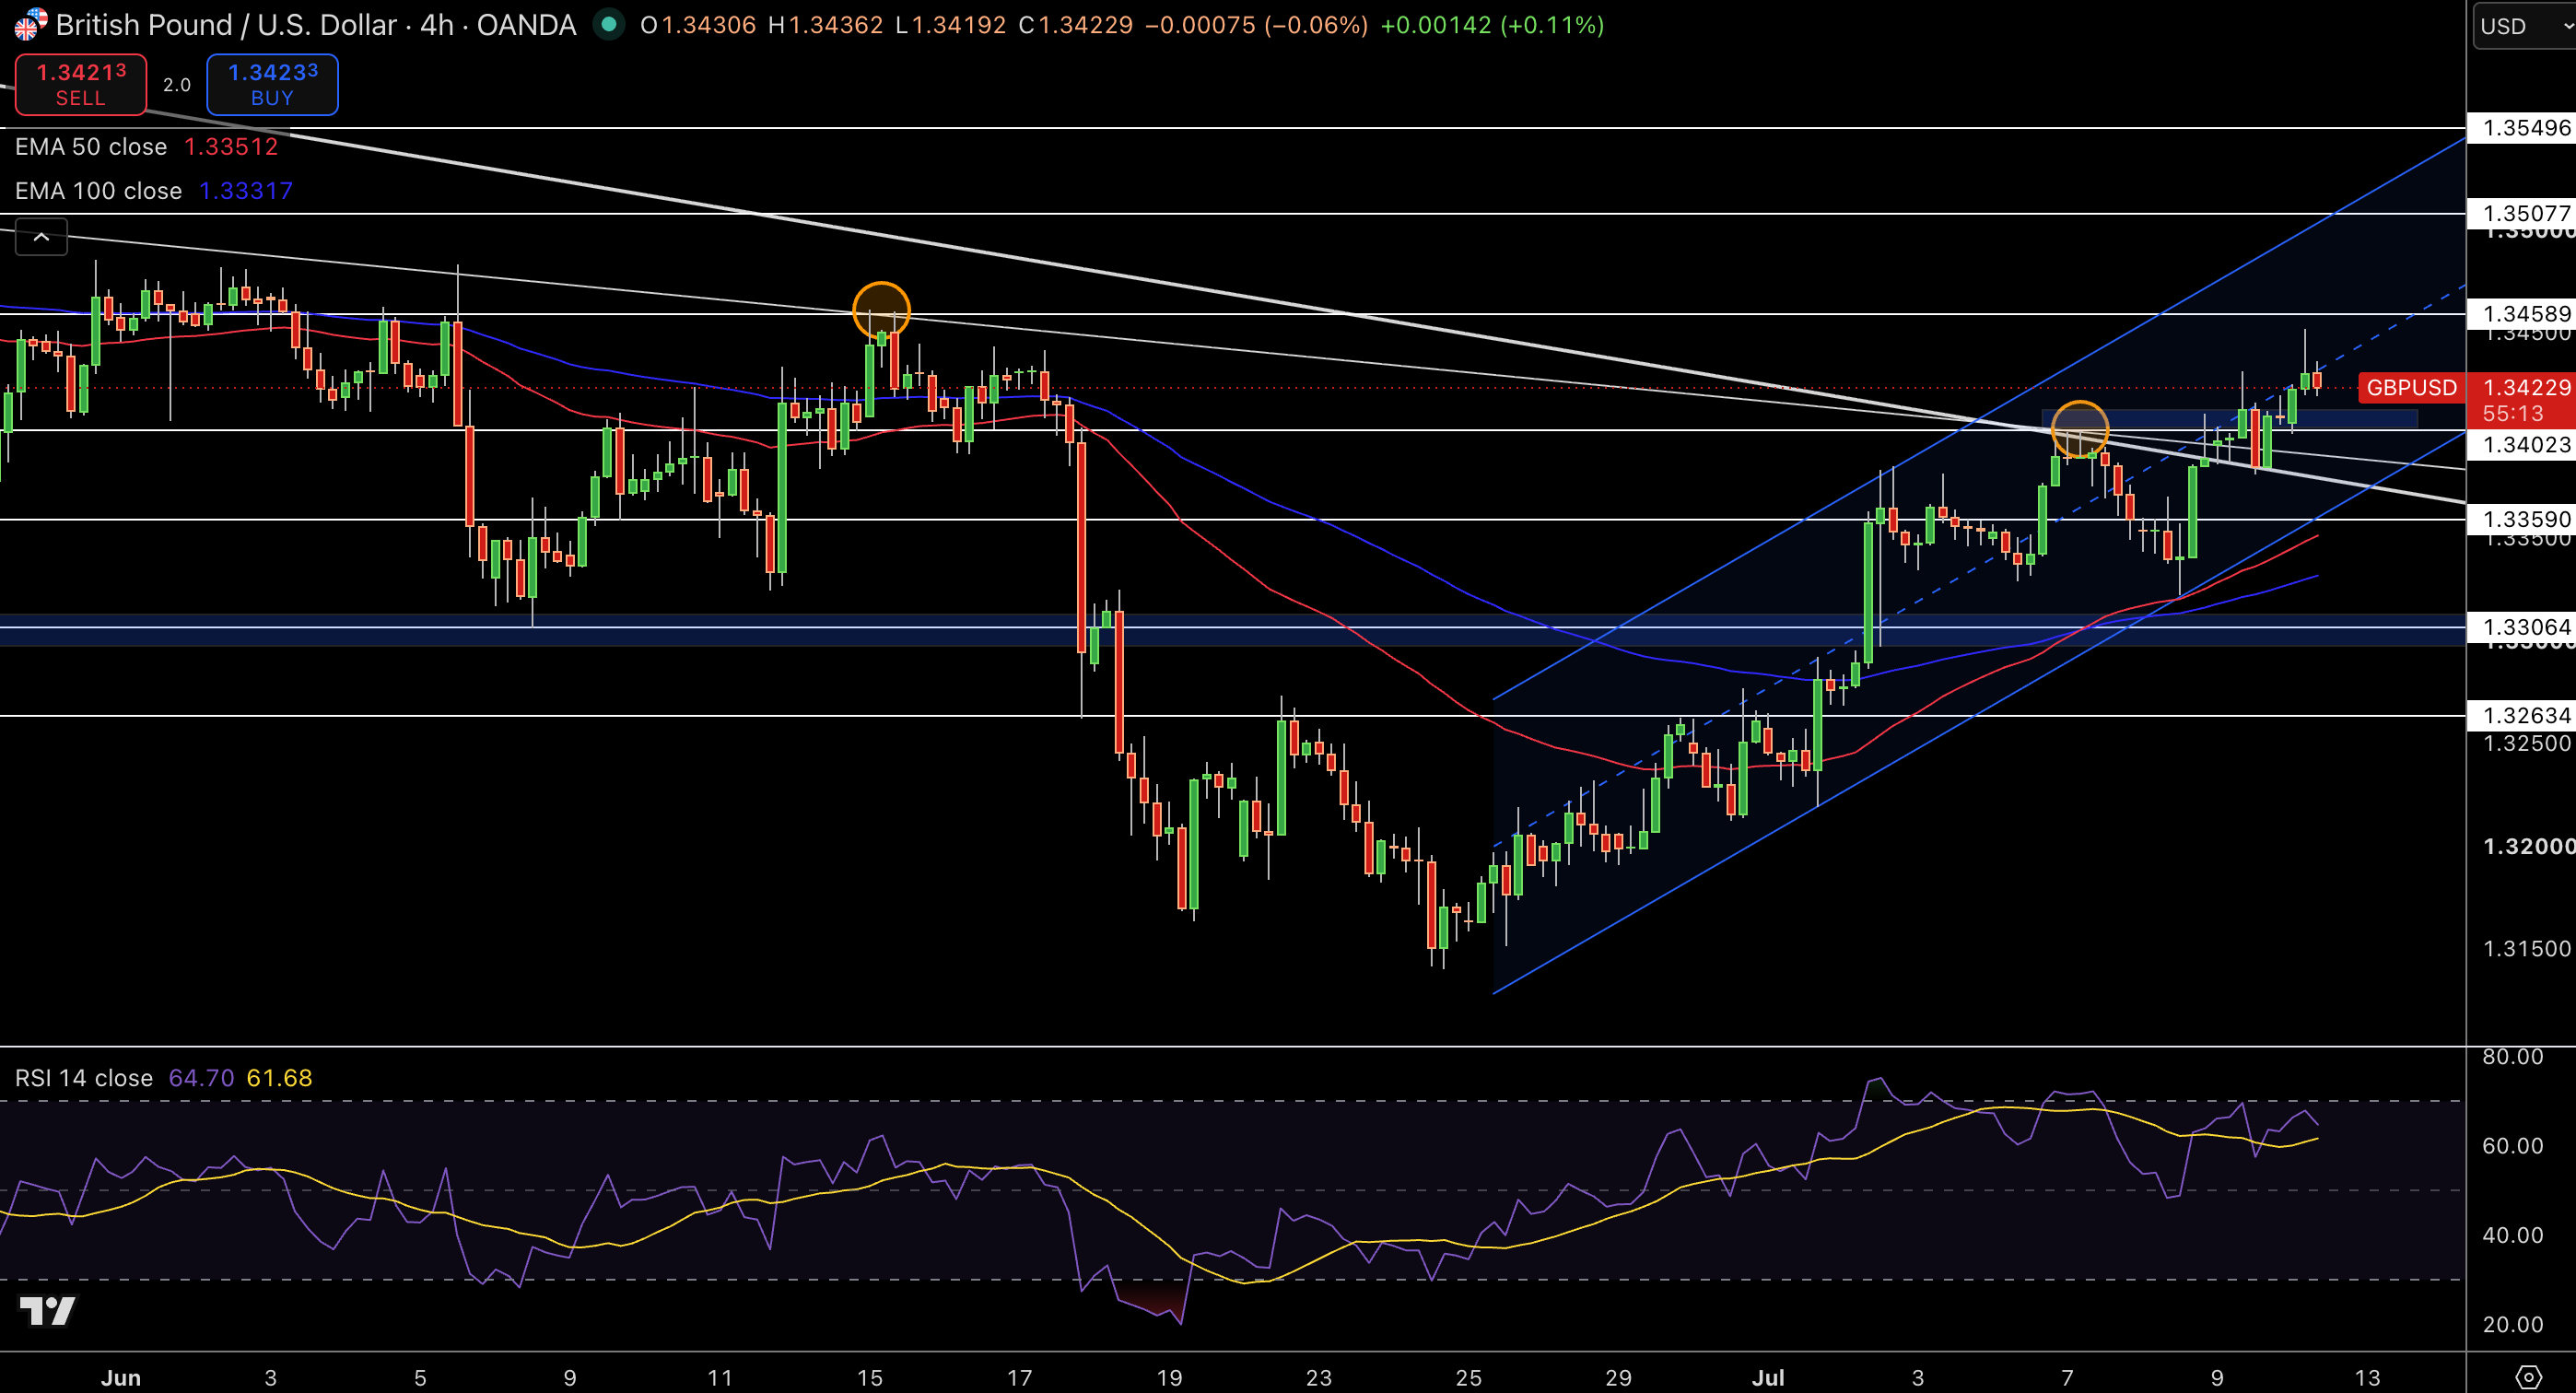
GBP/USD trades at $1.3422 on the 4-hour chart. Alternating green and red candles defended the 50-period EMA close to $1.3320 after the pair was rejected by the red moving average around $1.337. The presence of bullish wicks suggests that buyers are absorbing sell volume at support, while a string of higher lows is preserved.
The RSI is currently around 65, with the indicator hovering in neutral to bullish territory. Volume profile indicates $1.331 to $1.338 as a strong pivot cluster. The next price area to watch is within the range of $1.345 to $1.350. The market remains neutral-to-bullish in the hands of the buyers above the 50-period EMA in the context of a broader consolidating trend. A sequence of higher lows is keeping buyers in control of the market on pullbacks.
Trade Idea: Buy $1.3422, target $1.345, with a stop at $1.325.
EUR/USD Holds $1.1440 – EMA 50 Defense on 4h
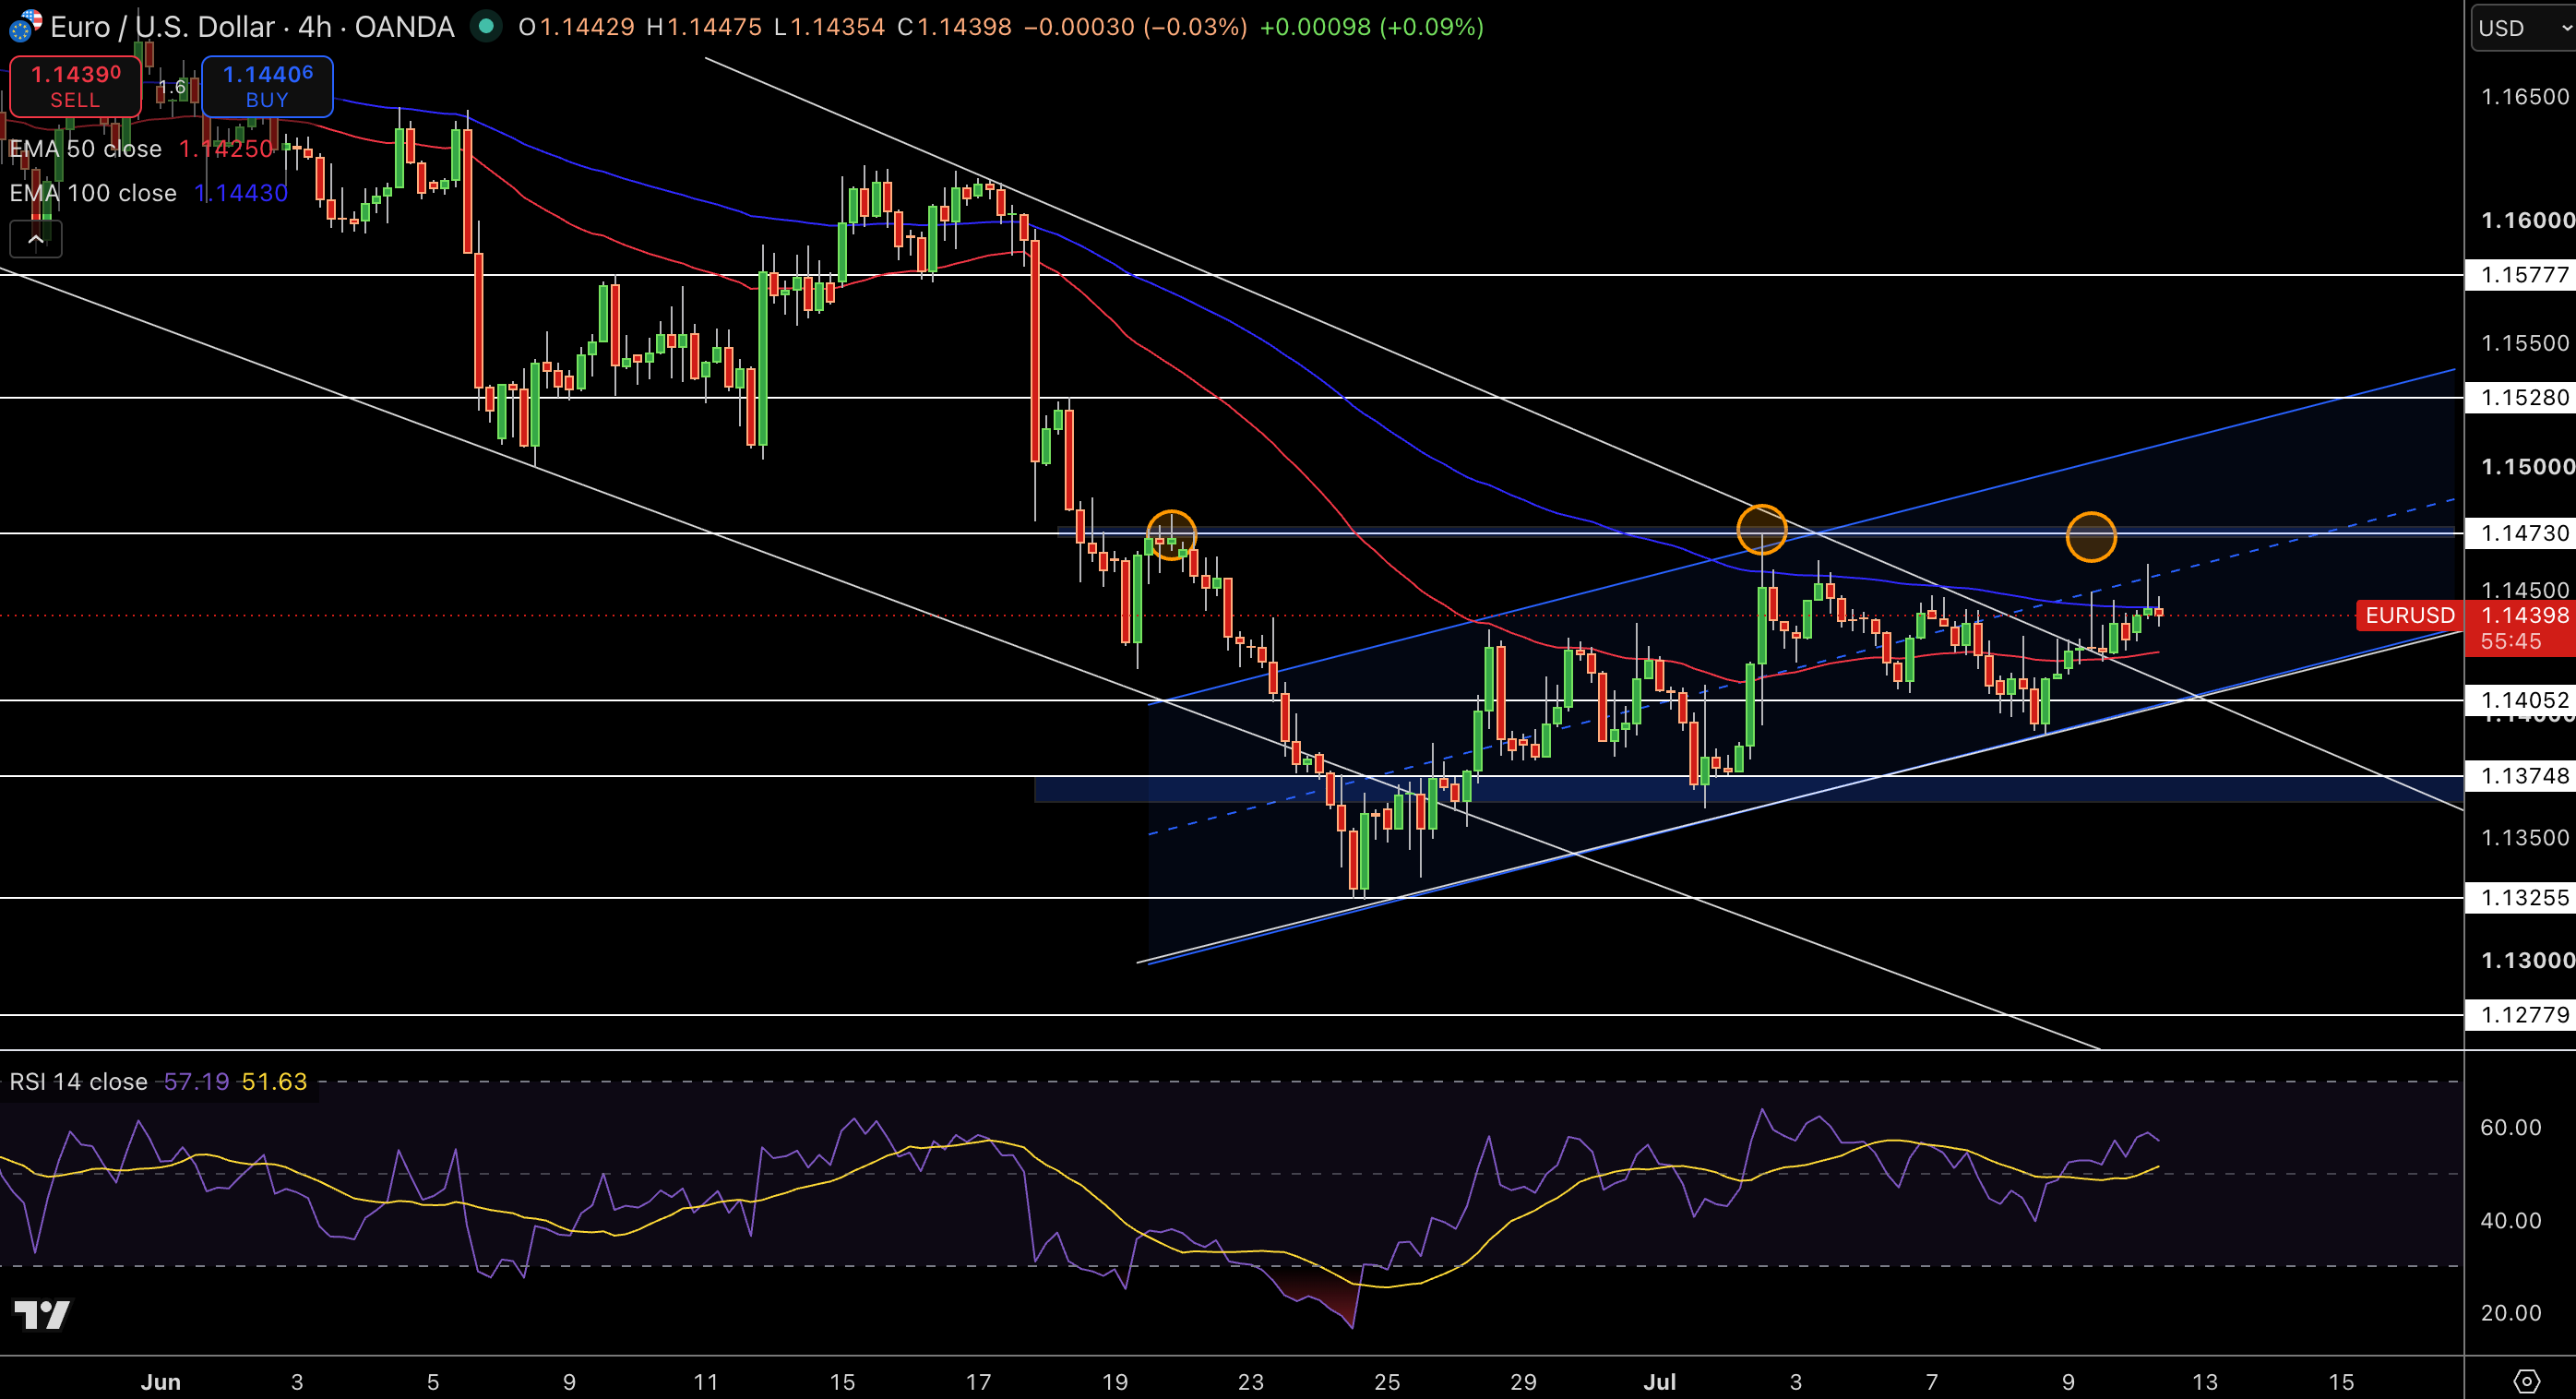
EUR/USD trades at $1.1440 on the 4-hour chart. Alternating green and red candles defended the 50-period EMA close to $1.1423 after the pair was rejected by the red moving average around $1.162. The presence of bullish wicks suggests that buyers are absorbing sell volume at support, while a string of higher lows is preserved.
The RSI is currently around 61, with the indicator hovering in neutral to bullish territory. Volume profile indicates $1.140 to $1.150 as a strong pivot cluster. The next price area to watch is within the range of $1.155 to $1.162. The market remains neutral-to-bullish in the hands of the buyers above the 50-period EMA in the context of a broader bearish trend. A sequence of higher lows is keeping buyers in control of the market on pullbacks.
Trade Idea: Buy $1.1440, target $1.155, with a stop at $1.140.