Natural Gas markets initially tried to rally during the week but found the area near the $3.10 level to be far too resistive yet again. By the time we
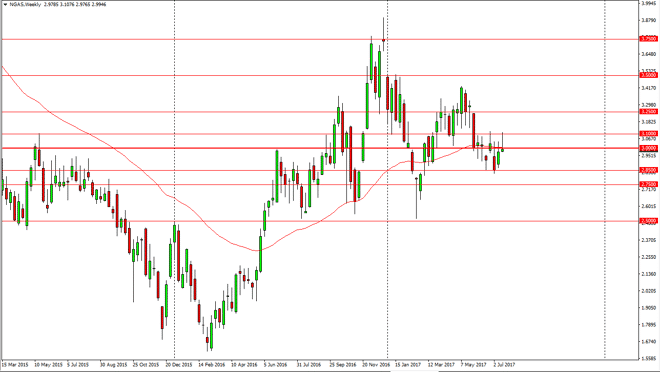
Natural Gas markets initially tried to rally during the week but found the area near the $3.10 level to be far too resistive yet again. By the time we started to close out on Friday, we had formed a massive shooting star that sits just below the $3 level. This is a very bearish sign, and to add further bearish pressure, we are sitting just below the 50-week moving average as well. Because of this, I think we are going to go down to the next major support level, the $2.85 level. Longer-term, we continue to have a massive amount of bearish pressure, as there is more than enough natural gas to overcome any type of demand issue.
I continue to believe that selling rallies is the way to go, as eventually I believe we will go looking towards the $2.50 level longer term. That’s not to say that we won’t bounce around, I certainly think we will. However, the demand simply is not there for natural gas. I have no interest in buying, because even if we did break above the top of the shooting star for the week, I believe there’s even more resistance at the $3.25 level. This is as close to a “one-way bet” as I have seen recently, and therefore I continue to be very bearish overall. Look for volatility, but quite frankly bearish pressure should win every time.
Chris is a proprietary trader with more than 20 years of experience across various markets, including currencies, indices and commodities. As a senior analyst at FXEmpire since the website’s early days, he offers readers advanced market perspectives to navigate today’s financial landscape with confidence.