Advertisement
Advertisement
Natural Gas Price Analysis for August 4, 2017
By:
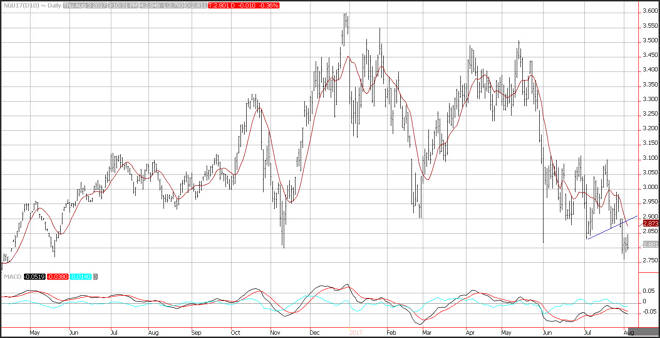
Natural gas prices whipsawed and stayed in a tight range, forming a bear flag pattern which is a pause that refreshes lower. A slightly less than expected
Natural gas prices whipsawed and stayed in a tight range, forming a bear flag pattern which is a pause that refreshes lower. A slightly less than expected build in natural gas inventories initially buoyed prices, but the cooler than normal forecast for weather in the mid-west saw sellers come in quickly. Support is seen near the weekly lows at 2.76. Resistance is seen near the 10-day moving average at 2.87. Momentum is negative as the MACD (moving average convergence divergence) histogram prints in the red with a downward sloping trajectory which points to lower prices.
Natural gas Inventories Climbed Less than Expected
The EIA reported that working gas in storage was 3,010 Bcf as of Friday, July 28, 2017. This represents a net increase of 20 Bcf from the previous week. Stocks were 279 Bcf less than last year at this time and 87 Bcf above the five-year average of 2,923 Bcf. At 3,010 Bcf, total working gas is within the five-year historical range.
About the Author
David Beckerauthor
David Becker focuses his attention on various consulting and portfolio management activities at Fortuity LLC, where he currently provides oversight for a multimillion-dollar portfolio consisting of commodities, debt, equities, real estate, and more.
Advertisement
