


Second Straight Bearish Session
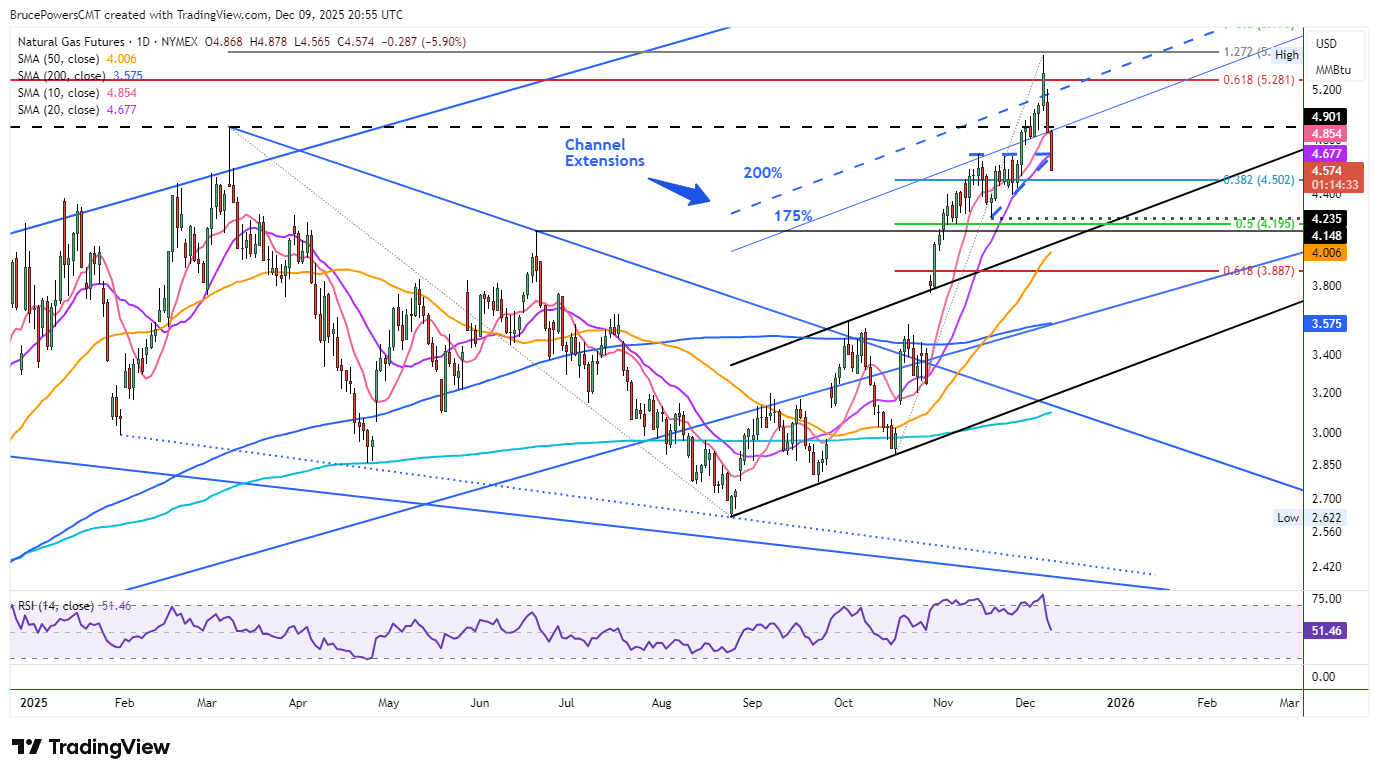
Sellers maintained control Tuesday, driving natural gas to a seven-day low of $4.57 while price continues trading near session lows at writing. The lower daily high of $4.88 cemented resistance at the former support of the 10-day average—classic bearish conversion after that line had underpinned the entire rally since the November 28 defense of the 20-day average.
20-Day Breakdown Confirmation
Tuesday’s move decisively sliced through the 20-day average at $4.68, with a daily close below set to confirm the breakdown. Combined with the sharp reversal from last week’s $5.50 extreme, this failure points squarely to continued downside momentum.
Weekly Reversal Activated
The decline also triggered a one-week bearish reversal below last week’s $4.76 low, breaking the multi-month pattern of higher weekly highs and lows. A close beneath that level locks in the weekly shift and reinforces bearish dominance across timeframes.
Immediate Downside Objectives
The trajectory now favors a relatively swift test of the next major support zone around the recent swing low at $4.24 and the rising 10-week average near $4.18, with nearby June levels around $4.15 adding potential reinforcement.
Deeper Correction Targets
After the prolonged and extended rally from late-October, corrective action looks warranted. A confirmed 20-day break opens the 50-day average at $4.01—currently converging with a rising top channel line—as the next logical downside price magnet. Should that fail, the 200-day average at $3.58, aligned with a long-term uptrend line untouched since late-October, enters focus as significant deeper support.
Natural Gas Price Forecast
Every new Natural Gas analysis as it publishes, today's technical signal and key levels, live price — on one page.
See all Natural Gas forecastsOutlook
Two days of heavy selling have flipped the short-term structure firmly bearish with the 20-day and weekly breakdowns confirming momentum now favors lower prices. Look for $4.24–$4.18 first, then $4.01 and potentially $3.58 on continued weakness; only a rapid reclaim of the 20-day average would begin to neutralize the current bearish shift.
For a look at all of today’s economic events, check out our economic calendar.