Bullish Breakout Shifts Market Structure
Palantir Technologies Inc. (PLTR) stock is showing signs of a possible structural bottom, suggesting that its multi-month bearish correction may be ending as buyers begin to take back control. On Thursday, PLTR triggered an upside breakout of a confirmed downtrend line featuring four distinct touches, concurrent with a reclaim of the 50-day moving average at $145. Crucially, volume spiked to a 10-day high on the breakout, indicating broad participation.
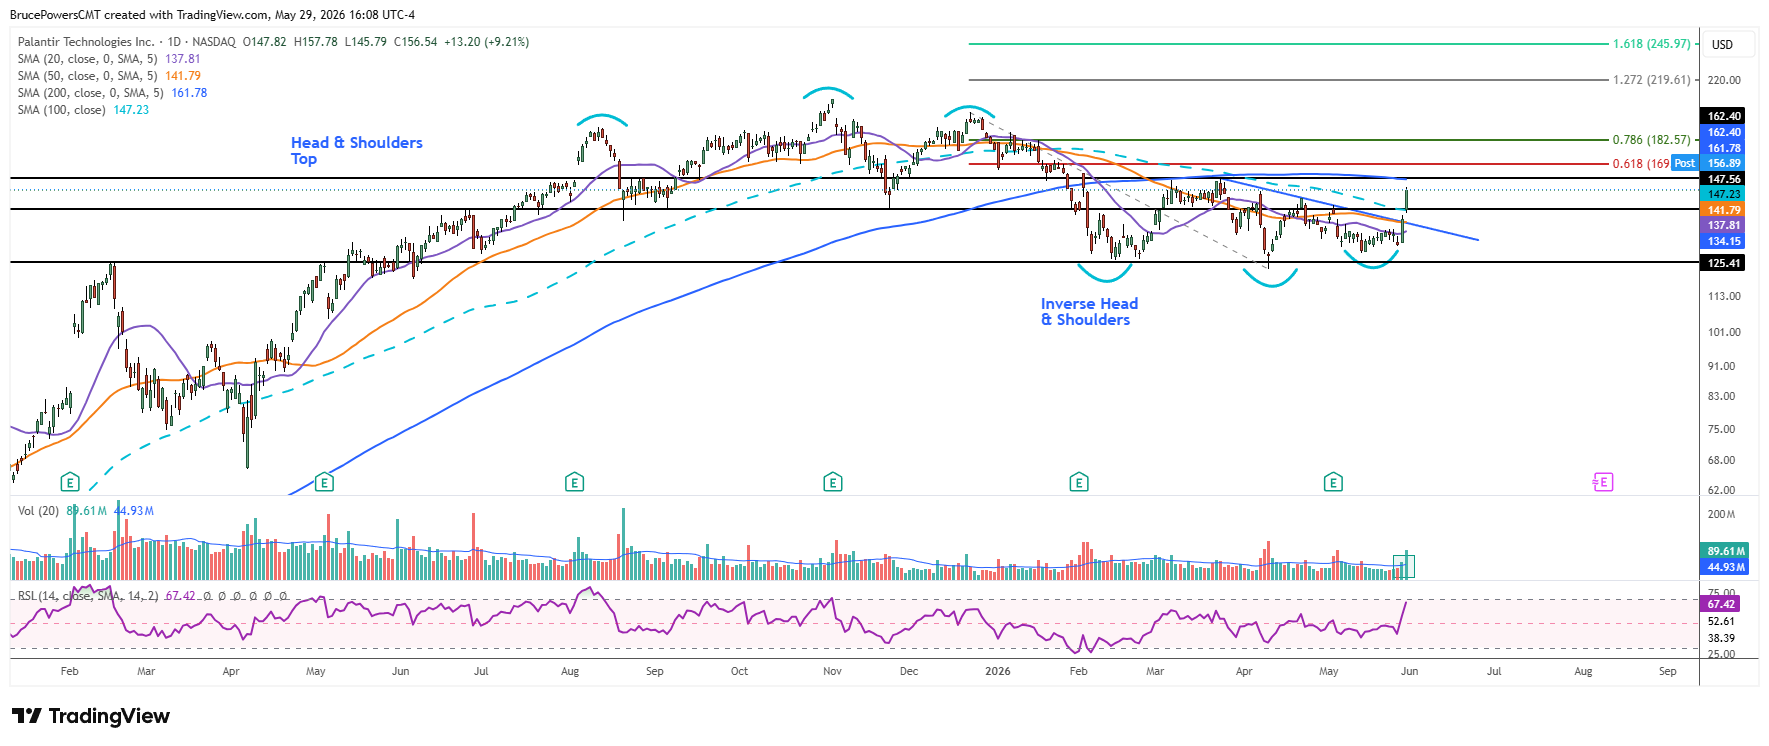
Strength was further confirmed on Friday as the advance accelerated. PLTR reclaimed its 100-day moving average at $147.23 and triggered a bullish reversal signal above the previous lower swing high of $156.28 on daily volume elevated above the 20-day average. The stock now appears to be heading next towards a test of resistance near the 200-day moving average near $161.78 and the neckline of an inverse head and shoulders pattern at $162.40. A sustained reclaim of the 100-day moving average would provide significant evidence that buyers are firmly establishing a structural shift, as PLTR has traded below this key trend indicator since it failed as support in late January.

Navigating the Resistance Zone
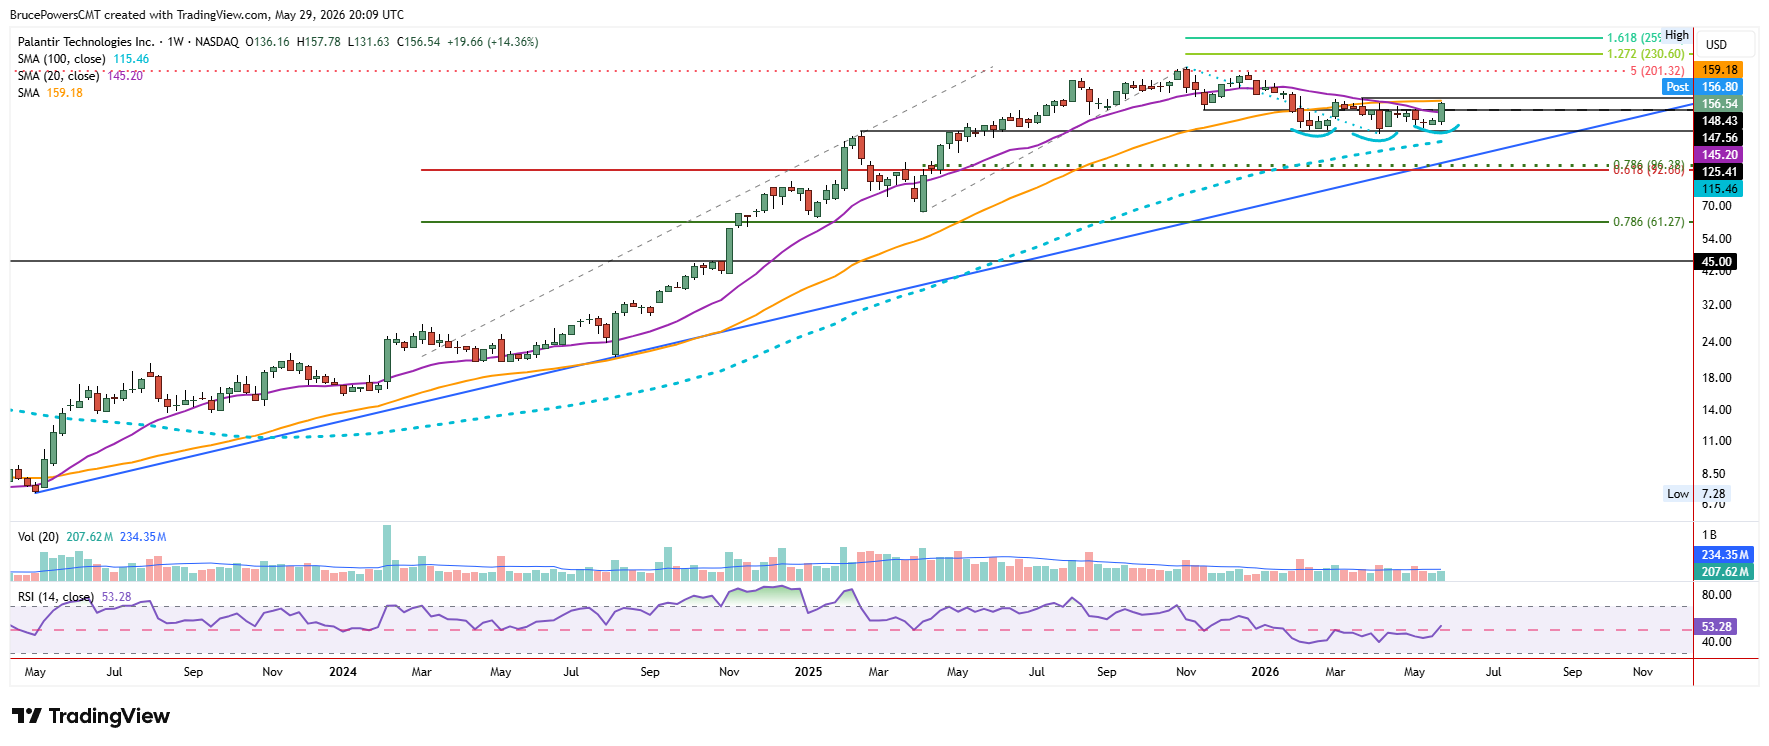
Because resistance is anticipated near the $161.78 to $162.40 price zone, the initial test may lead to a minor pullback. However, the first pullback following a significant breakout frequently produces attractive risk/reward conditions, as potential upside is extended, and the downside is structurally limited. Completion of that pullback should establish asymmetric entry opportunities in anticipation of a sustained recovery above $162.40. Clearing that barrier would further confirm a longer-term bullish reversal process.
Defining Key Downside Risk
This week’s bullish reversal signs in PLTR, if sustained by continued momentum, suggest the potential for the long-term bull trend to eventually resume and extend above the 2025 peak of $207.52. This means that the next pullback low may prove to be the lowest entry price for the stock in some time.
Currently, key downside is indicated near the recently reclaimed 100-day moving average and Friday’s higher daily low of $145.79. This zone is further validated by the neckline of the macro head-and-shoulders top reversal pattern that triggered in early February. Should this floor fail to hold, the 50-day moving average near $141.78 becomes the next potential downside target, marking the final line of defense to preserve this fledgling structural reclaim.
If you’d like to know more about technical analysis and how traders use it, please visit our educational area.