Advertisement
Advertisement
Shiba Inu and Dogecoin Close in Red As DOGE Slips Out of Top 10 List
Published: Aug 3, 2022, 18:48 GMT+00:00
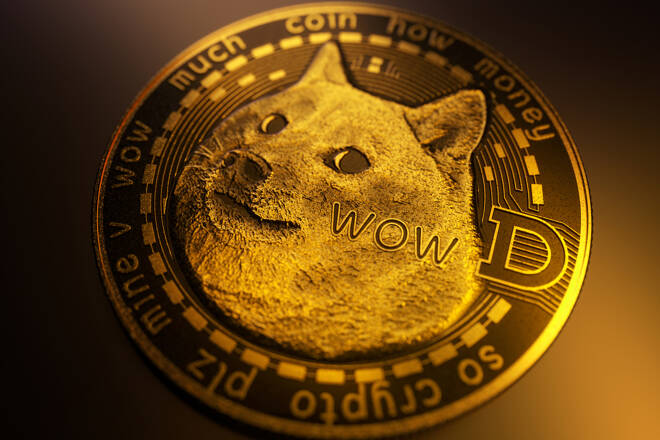
The meme coin market flourished today with a 2.79% rise despite Dogecoin and Shiba Inu losing their place among the top coins list.
Key Insights:
- Shiba Inu continued remaining in the same consolidation it’s been stuck in this week.
- Dogecoin also did not move by a lot to trade below the $0.07 mark.
- Bitcoin and Ethereum observed improvement as the market cap touched $1.065 Trillion.
As the broader market engaged in recovery after days of closing in red, meme coins took advantage and rose as well.
The overall meme coin market cap recovered to $16.1 billion despite Dogecoin and Shiba Inu losing their places in the top 10 and top 15 cryptocurrencies, respectively. Bitcoin and Ethereum, on the other hand, rose to trade at $23k and $1.66k, respectively.
Dogecoin Makes No Move
The meme coin could be seen trading at $0.067, finding consolidation in the same price level it has been at since the end of June.
Despite all the fluctuations, no significant change has been observed in its price action. However, DOGE has successfully maintained the 28.63% rally observed from the lows of the June crash.
Similar signals are exhibited by the price indicators as well, starting with the Parabolic SAR.
The white dots of the indicator are currently placed above the candlesticks, indicating a downtrend after exhibiting an uptrend for a week straight in mid-July.
The Awesome Oscillator also displayed no conclusive signal as the indicator kept switching between the red and green bars switching their place between above and below the neutral line.
This unsurety will keep DOGE away from recovering its 35.94% crash of June.
Shiba Inu Stays Put
Shiba Inu has been doing well for its investors in the macro time frame rising by 55.66% in the last month and a half.
Trading at $0.00001197 on the micro time frame, SHIB remained unmoved, though. This is making it difficult for the coin to close above the $0.00001200 mark.
The Bollinger Bands could be seen converging, which would highlight a drop in the volatility of the asset.
This could result in lower price swings which would have actually been beneficial for SHIB since the candlesticks were above the basis of the indicator, making it susceptible to a price rise more than a drop.
The MACD, on the other hand, is exhibiting no clear signal as the signal line (red) and the indicator line (white) continue to overlap each other for the seventh day straight.
Once a bearish or bullish crossover takes place, things would become far more apparent.
About the Author
Aaryamann Shrivastavaauthor
Holding a Mass Media Degree has enabled me to better understand the nitty-gritty of being a journalist and writing about cryptocurrencies’ news and price movements, effects of market developments, and the butterfly effect of individual assets nurtured me into a better investor as well.
Advertisement
