


Solana (SOL) hit a sell wall at $110 and has been progressively retreating since then, as expectations concerning interest rates shifted in the past few days.
Following the Federal Reserve’s Jackson Hole summit last week, analysts revisited their projections for interest rate decisions for September, upping their odds of a 25 basis point rate hike from 36% to 66%.
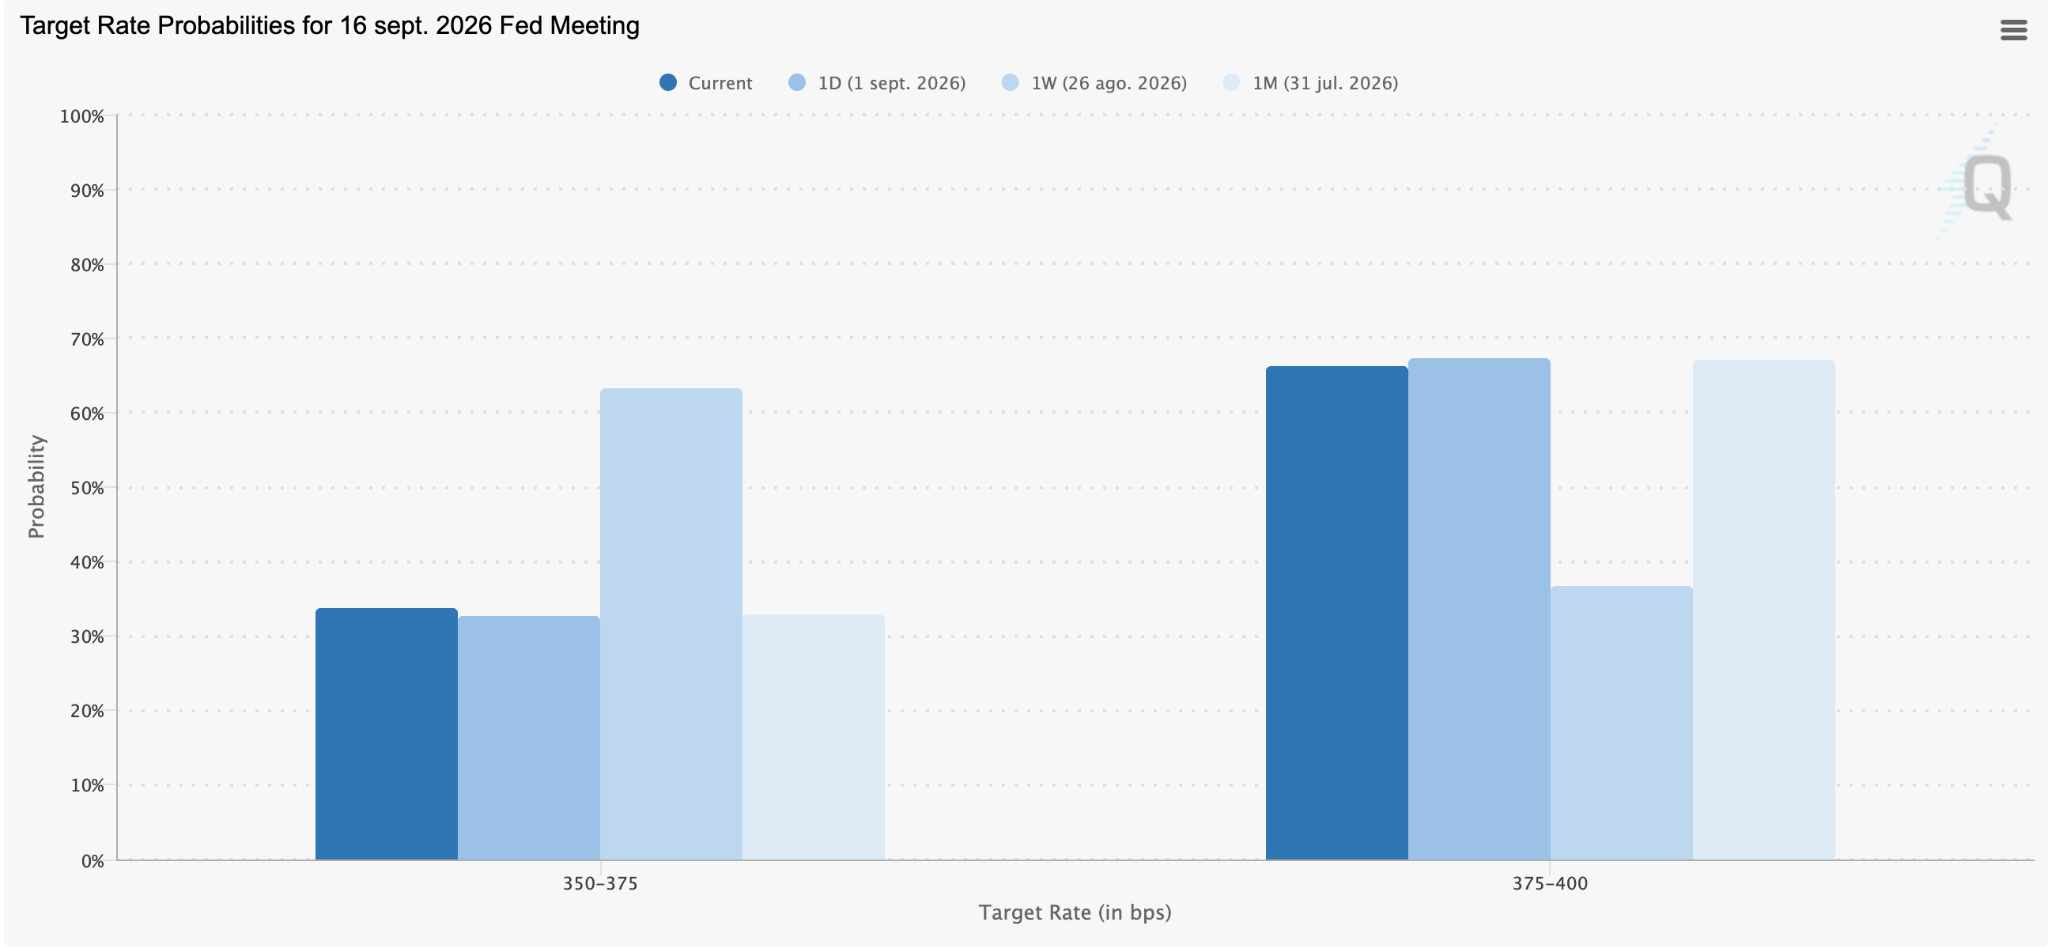
This prompted a wave of selling that has pushed SOL down to the $100 psychological threshold. However, the token could keep dropping, as this price zone has not yet proven to be a contested level.
Trading volumes have been dropping in the past few days, heading down to $3 billion after temporarily hitting $8 billion on August 21.
This indicates that investors’ interest in the token at this level is still weak. This could set the stage for a sustained decline to lower areas where a higher volume of buy orders may be sitting.
Investors Pile Into Solana ETFs Despite This Week’s Retreat
Despite the latest retreat, Wall Street has kept buying SOL via exchange-traded funds (ETFs), indicating a bullish positioning and positive expectations regarding the token’s future price action.
Data from SoSoValue shows that net inflows to these vehicles have been positive for 11 days in a row, with a total of $193 million flowing to SOL ETFs in August. This has been the highest monthly intake for these funds since November 2025, back when this altcoin traded at around $140.
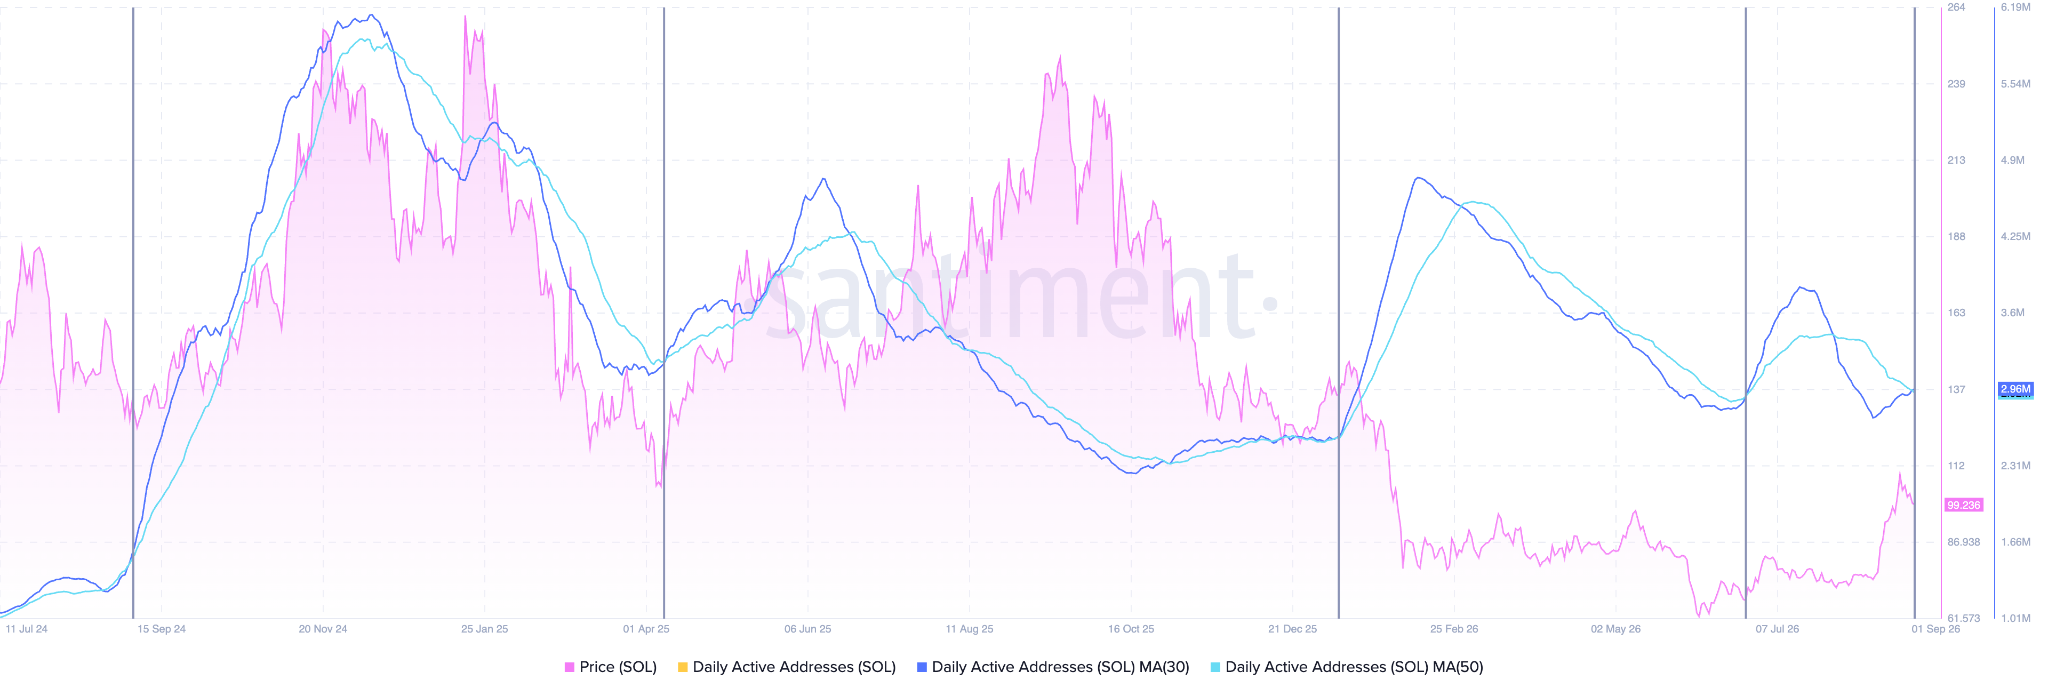
Meanwhile, we are once again witnessing a crossover between the 30-day and 50-day moving averages for active users, according to data from Santiment.
This on-chain metric signals increased network usage and, in past instances, a bullish crossover between these two lines has anticipated strong price movements.
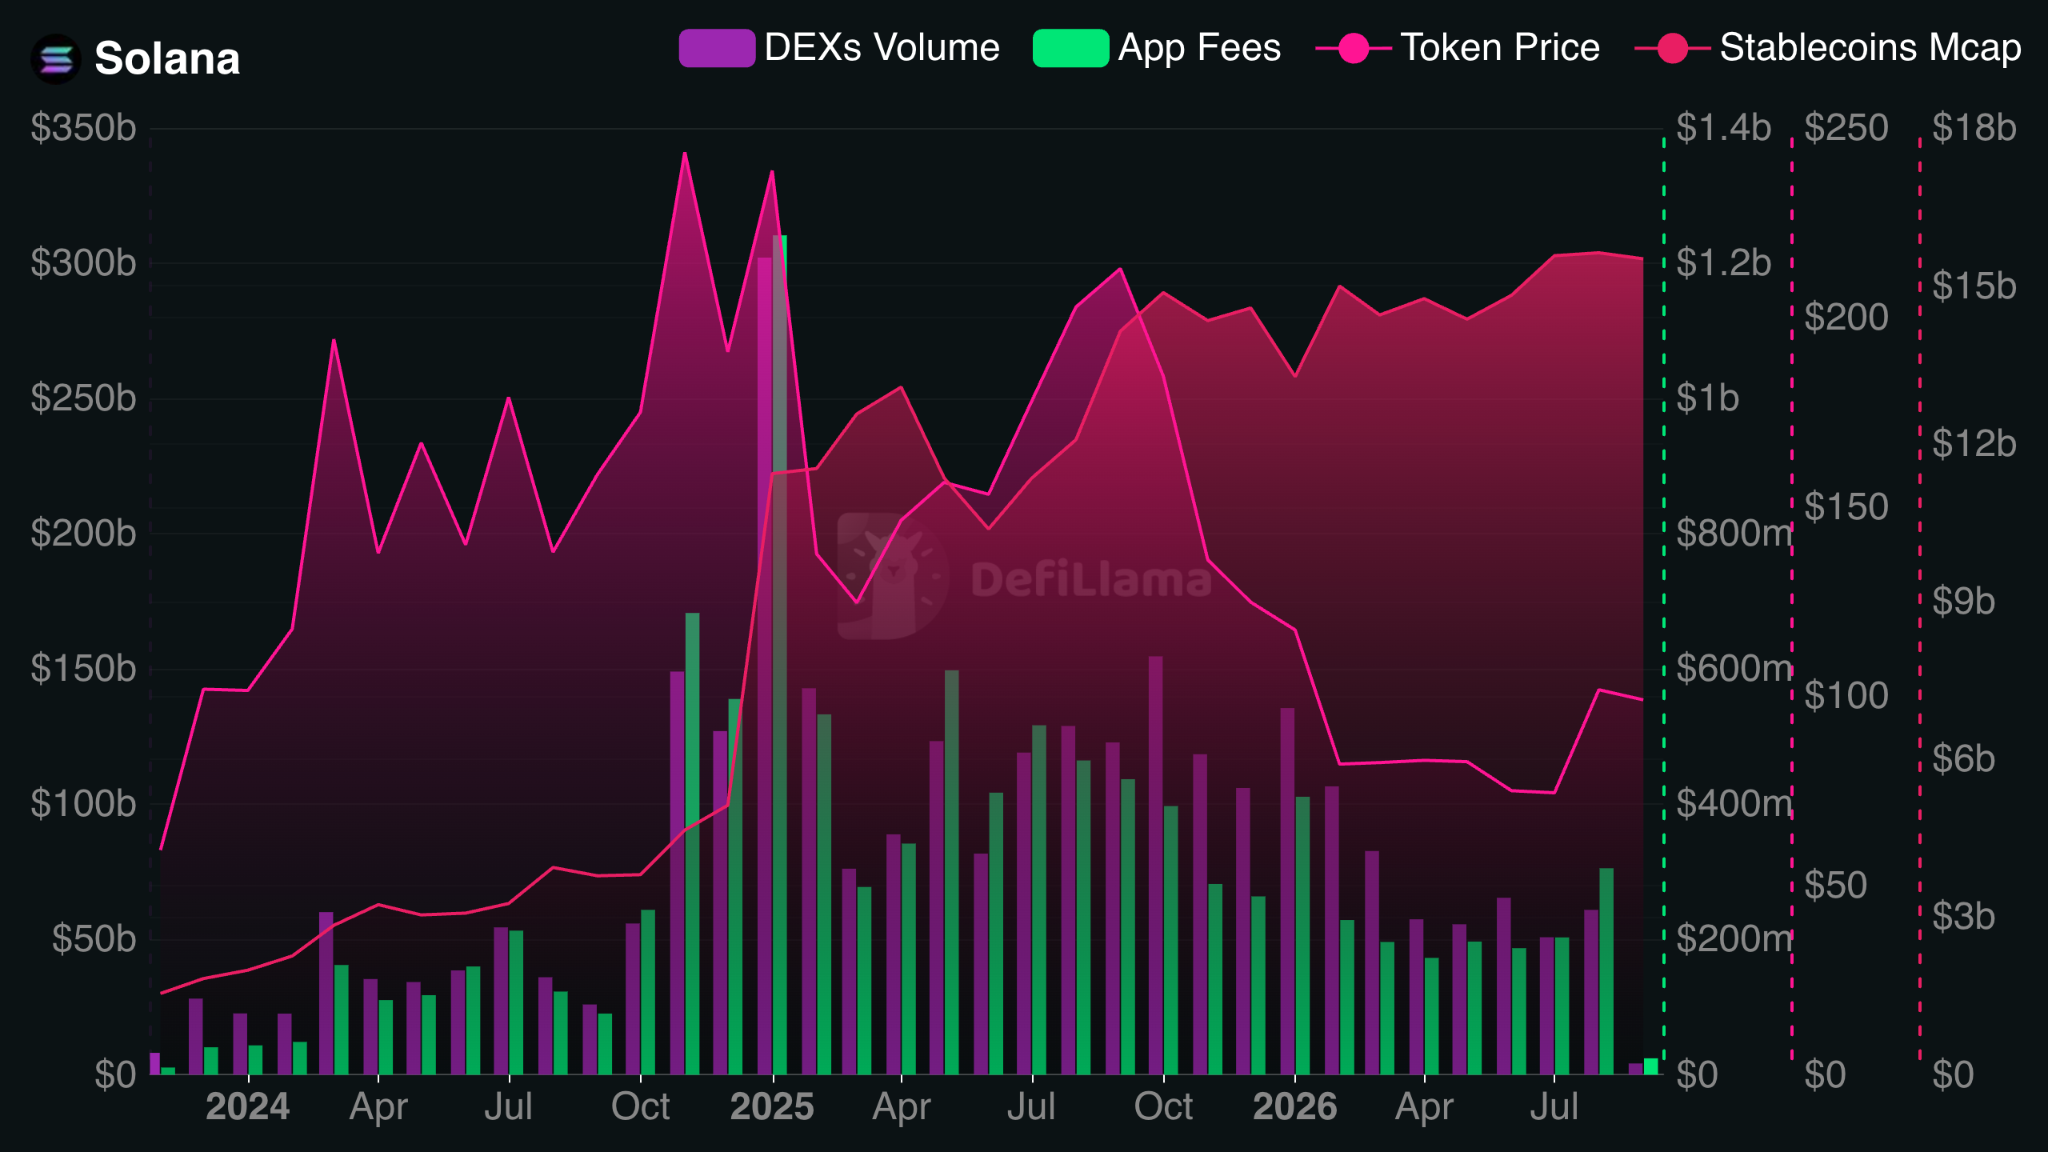
Last week, we also saw a strong spike in app fees within the Solana ecosystem. Data from Santiment indicates that dApps collected a total of $305 million during this period, resulting in a 50% jump compared to the week before.
Moreover, DEX volumes rose from $51 billion to $61 billion, as traders rushed to position for what could be the beginning of a bullish cycle for Solana — and possibly for memecoins, if positive momentum across the crypto space gains enough traction.
Solana Price Forecast
Every new Solana analysis as it publishes, today's technical signal and key levels, live price — on one page.
See all Solana forecastsSOL Needs to Stay Above $100 to Get Another Short at Rallying to $120
Heading to the daily chart, the price action seems to be struggling to stay above the $100 mark today.
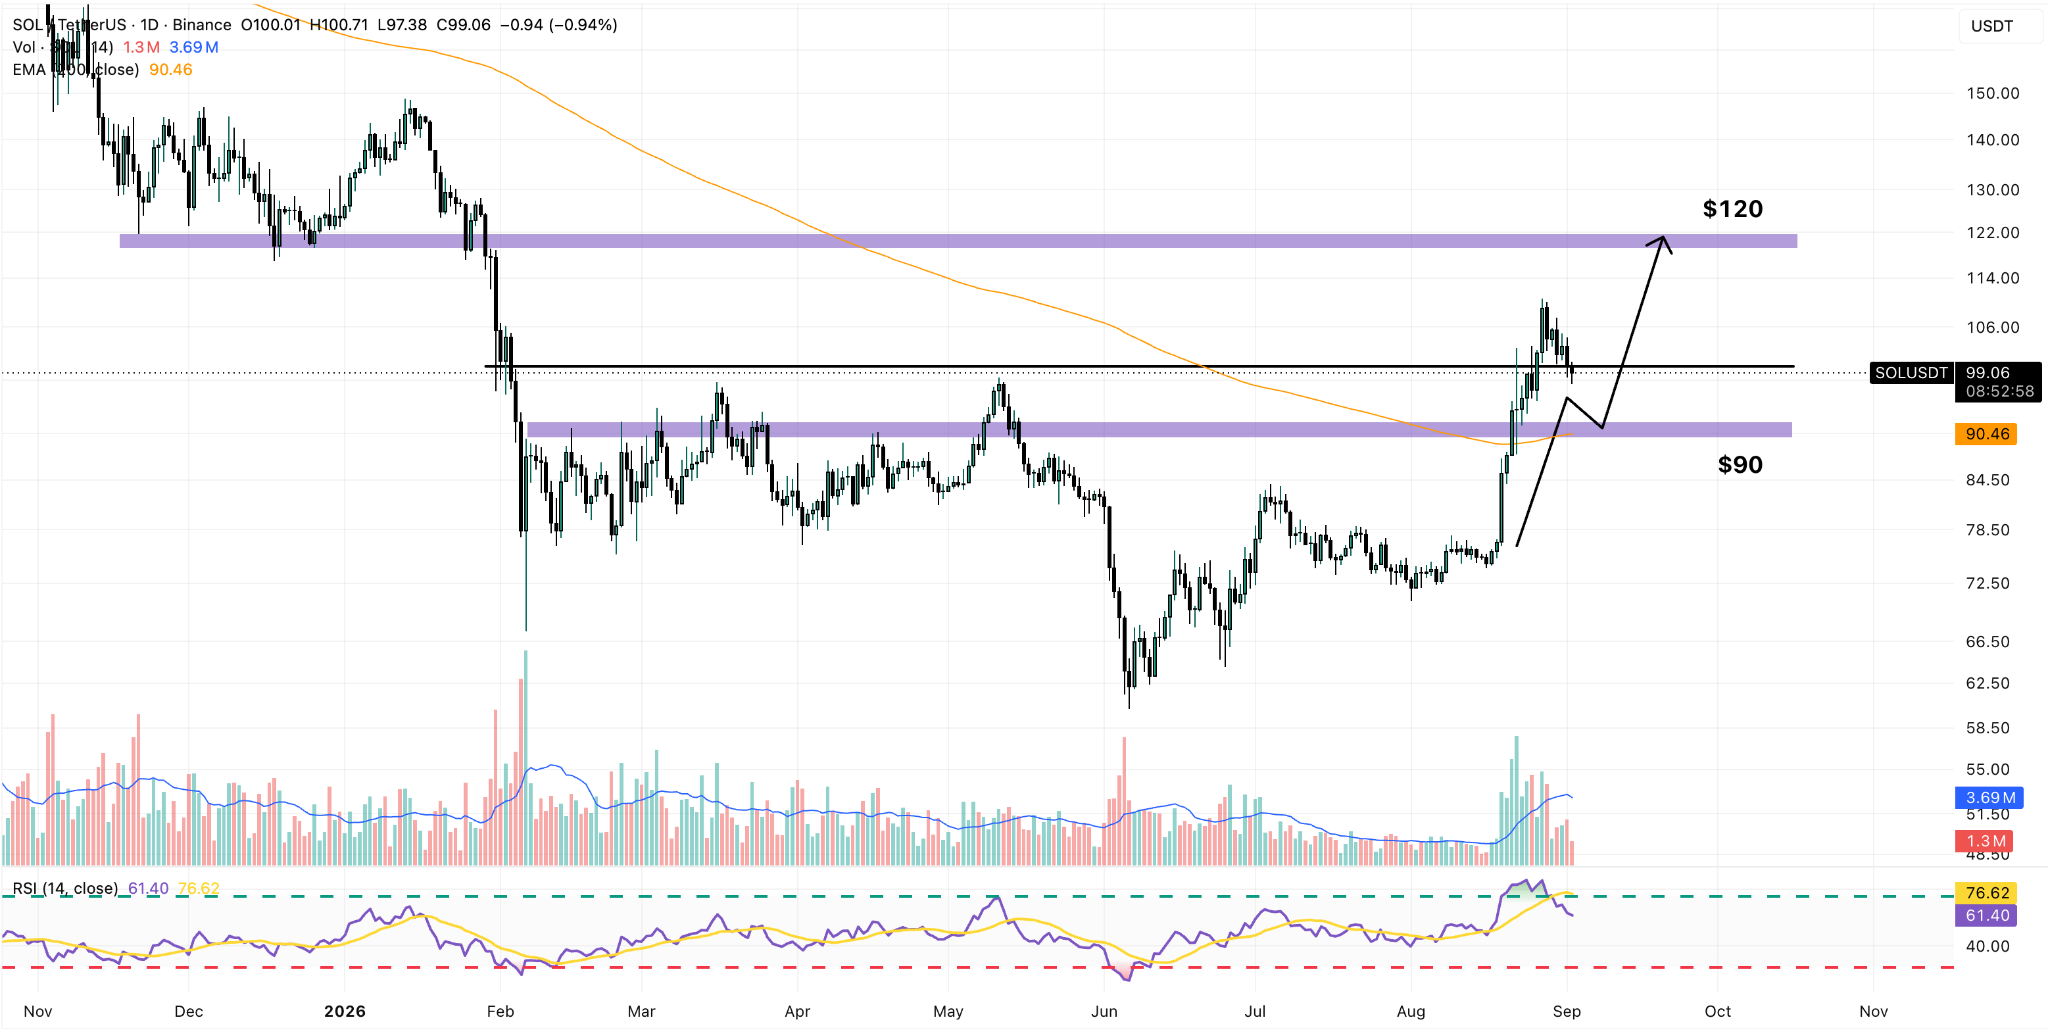
Positive momentum is now weaker compared to a week ago, as indicated by a bearish crossover between the Relative Strength Index (RSI) and the signal line.
This favors the continuation of the current downtrend toward what we see as the most relevant support level for SOL at $90. This price zone exhibits confluence between a former horizontal resistance and the 200-day exponential moving average (EMA).
Meanwhile, if the $100 area holds, SOL may resume its rally to $120, implying a 20% upside potential for the token in the near term.