Chip Selling Deepens but the Rotation Is Absorbing It
The semiconductor selloff extended into a second session Thursday and the Nasdaq is down nearly 1% while the Dow holds positive on healthcare strength. Retail sales and jobless claims both supported the soft landing read, and the market is rotating money out of tech into defensive sectors rather than pulling it out of equities entirely. The Houthi Red Sea threat is the new geopolitical input keeping oil elevated and complicating the rate story that two days of soft inflation data just simplified.
At 17:02 GMT, the S&P 500 Index is trading 7549.31, down 23.09 or -0.30%. The Nasdaq Composite is trading 26014.362, down 254.866 or -0.97% and the Dow is trading 52703.19, up 44.55 or +0.08%.

Daily S&P 500 Index (SPX) Technical Analysis
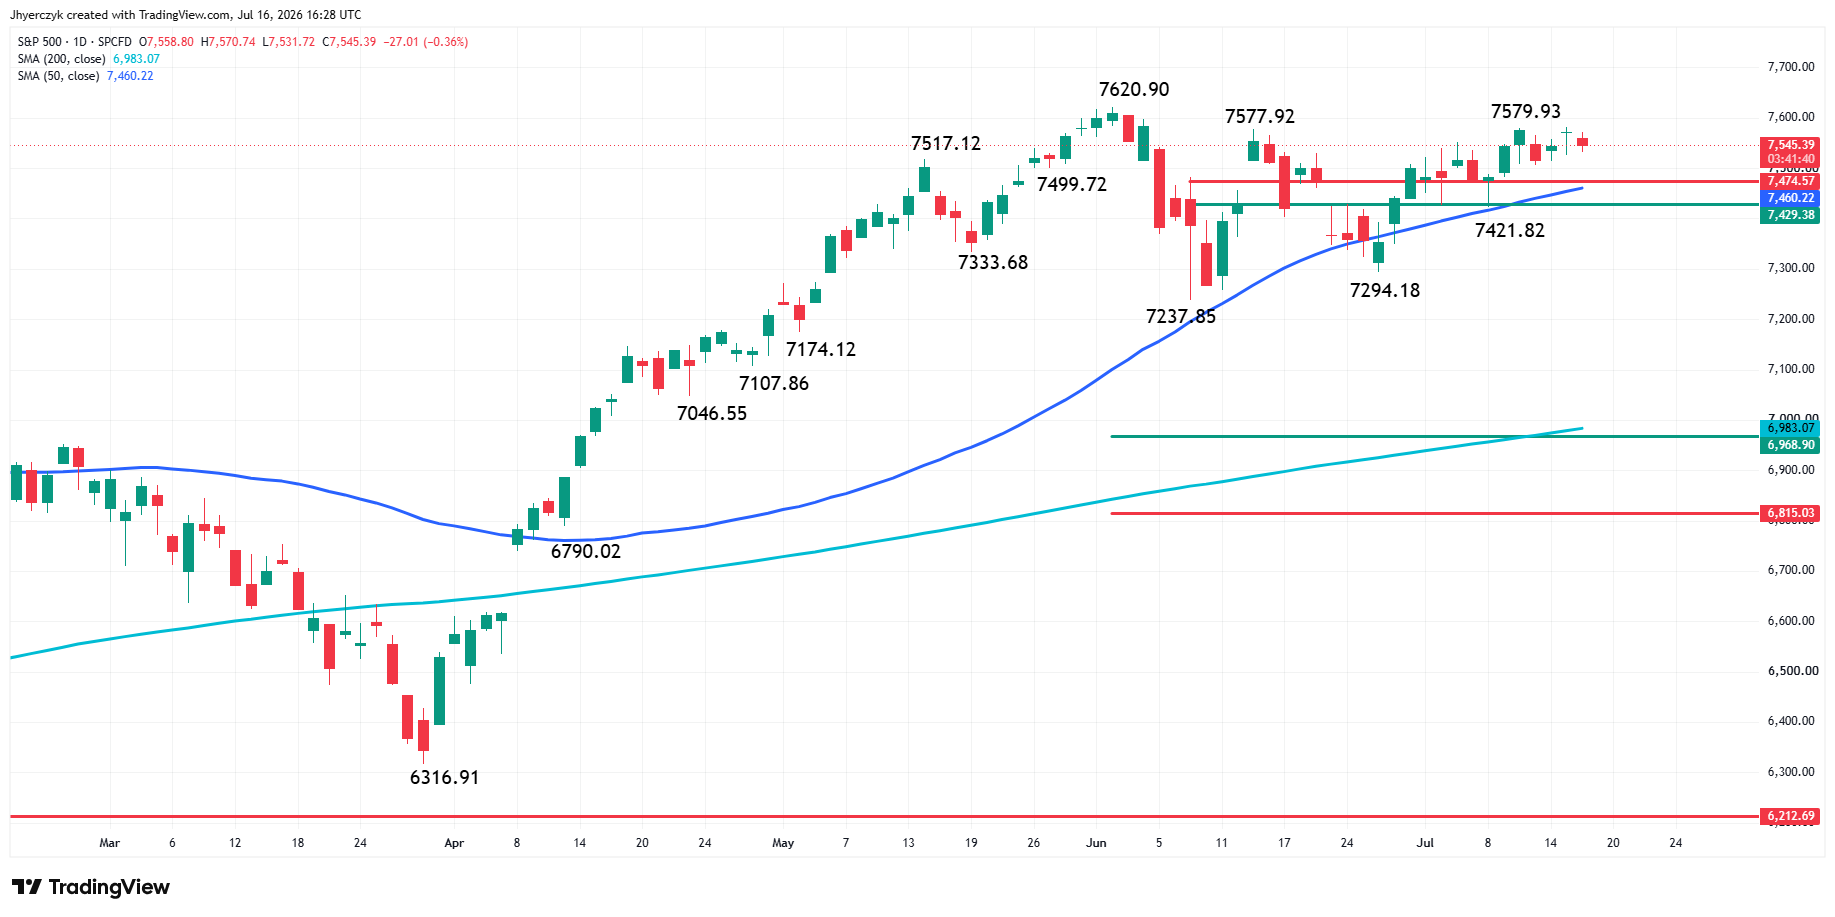
The benchmark S&P 500 Index is edging lower on Thursday while trading inside yesterday’s range. This chart pattern typically indicates investor indecision and impending volatility.
Despite the somewhat neutral set up today, the index is still in an uptrend based on the classic definition of higher tops and higher bottoms. The trend isn’t the issue today. It’s momentum. Without momentum to drive it toward the record high at 7620.90, my focus has shifted to the key support area at 7474.57 to 7429.38 and the 50-day moving average at 7460.24. This is the area that needs to hold, or the entire trend can flip quickly.
We’ll be watching into the close to see if traders try to break the inside move with a surge toward the record or a breakdown through the support zone.
Daily Nasdaq Composite (IXIC) Technical Analysis
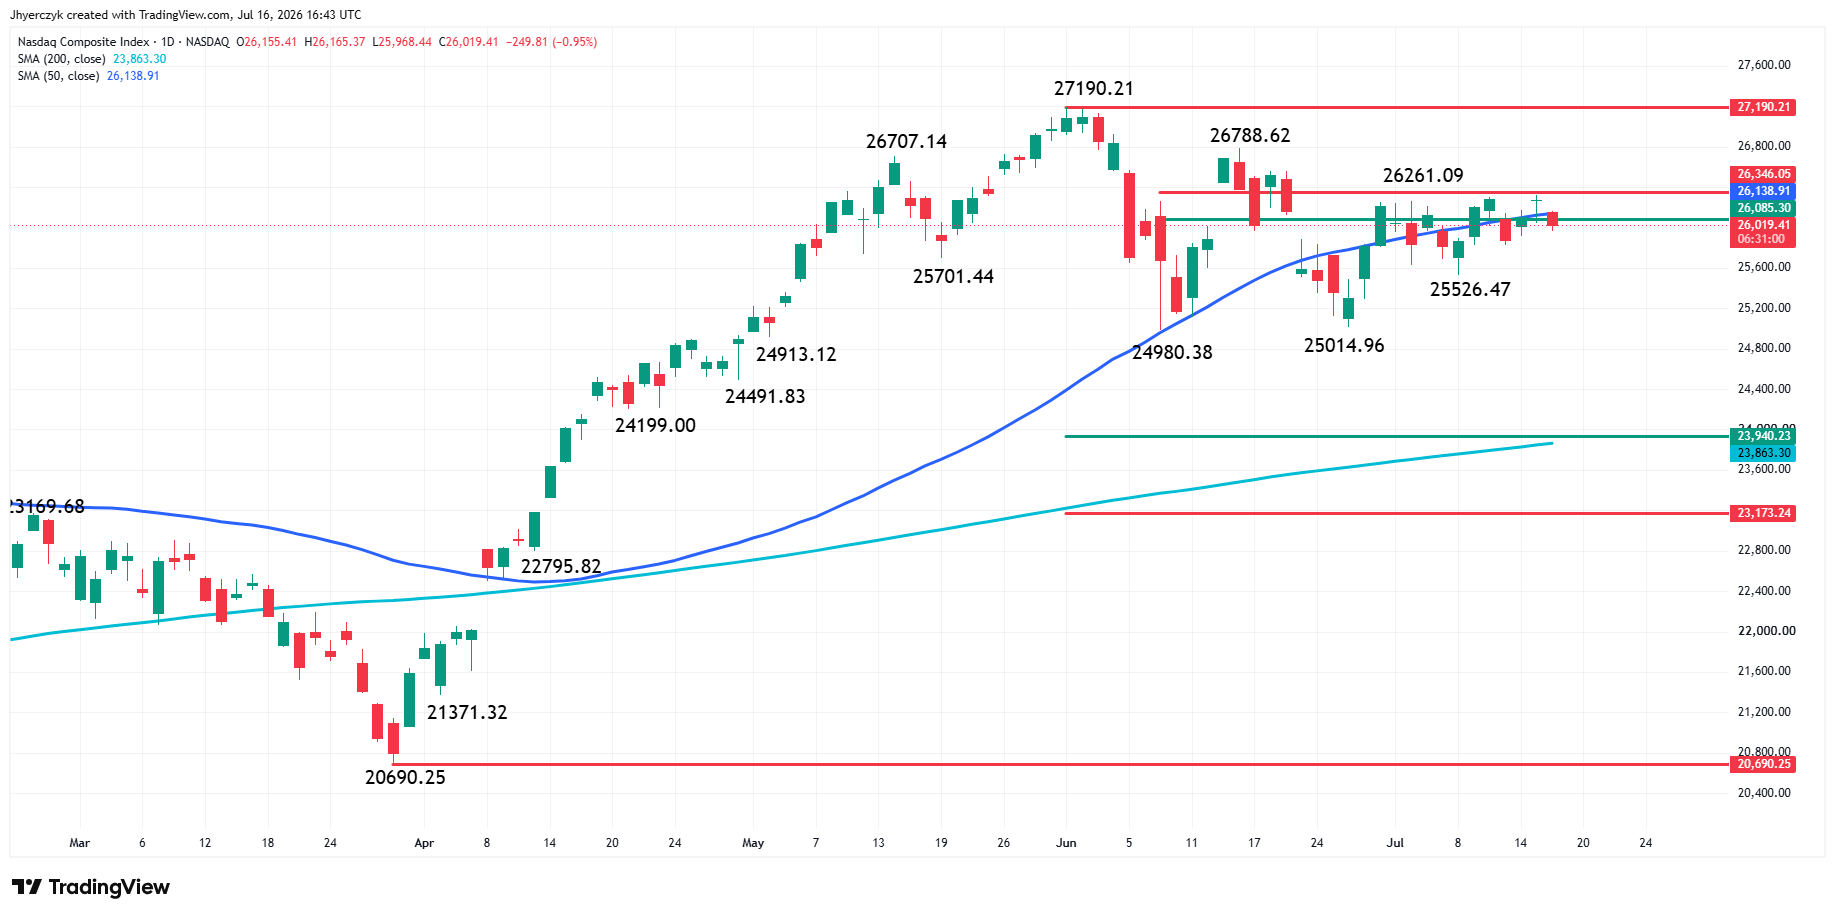
The Nasdaq Composite Index is trading lower at the mid-session after gapping its 50-day moving average at 26138.97 and threatening to take out the lower end of a short-term retracement zone at 26085.30.
Dow Jones Price Forecast
Every new Dow Jones analysis as it publishes, today's technical signal and key levels, live price — on one page.
See all Dow Jones forecastsThe area everyone should be focusing on is the short-term retracement zone at 26085.30 to 26346.05. Investor reaction to this area could help determine the next major move.
For the bullish trader, the sequence is overcome the 50-day moving average, build enough upside momentum to overtake the 61.8% level at 26346.05 then surge through swing tops. This type of move will need a volume surge and we could get it with institutional moving average buyers, Elliott Wave Fibonacci traders and swing top Gann traders. The bullish trifecta.
With traders pressing through two of the three levels, we have to take a look at the short side too. Will we get institutional selling on the breakdown under the 50-day moving average? If we do, we could see an acceleration into the swing bottom at 25526.47 and a failure there too. This would put the next two swing bottoms on the radar at 25014.96 and 24980.38.
The market is asking investors right now, are you willing to buy strength for an upside breakout and a new record high, or do you prefer to wait for a test of a value area like the long-term retracement zone at 23940.23 to 23173.24 and the 200-day moving average at 23863.24?
Two Days of Selling on Good Earnings
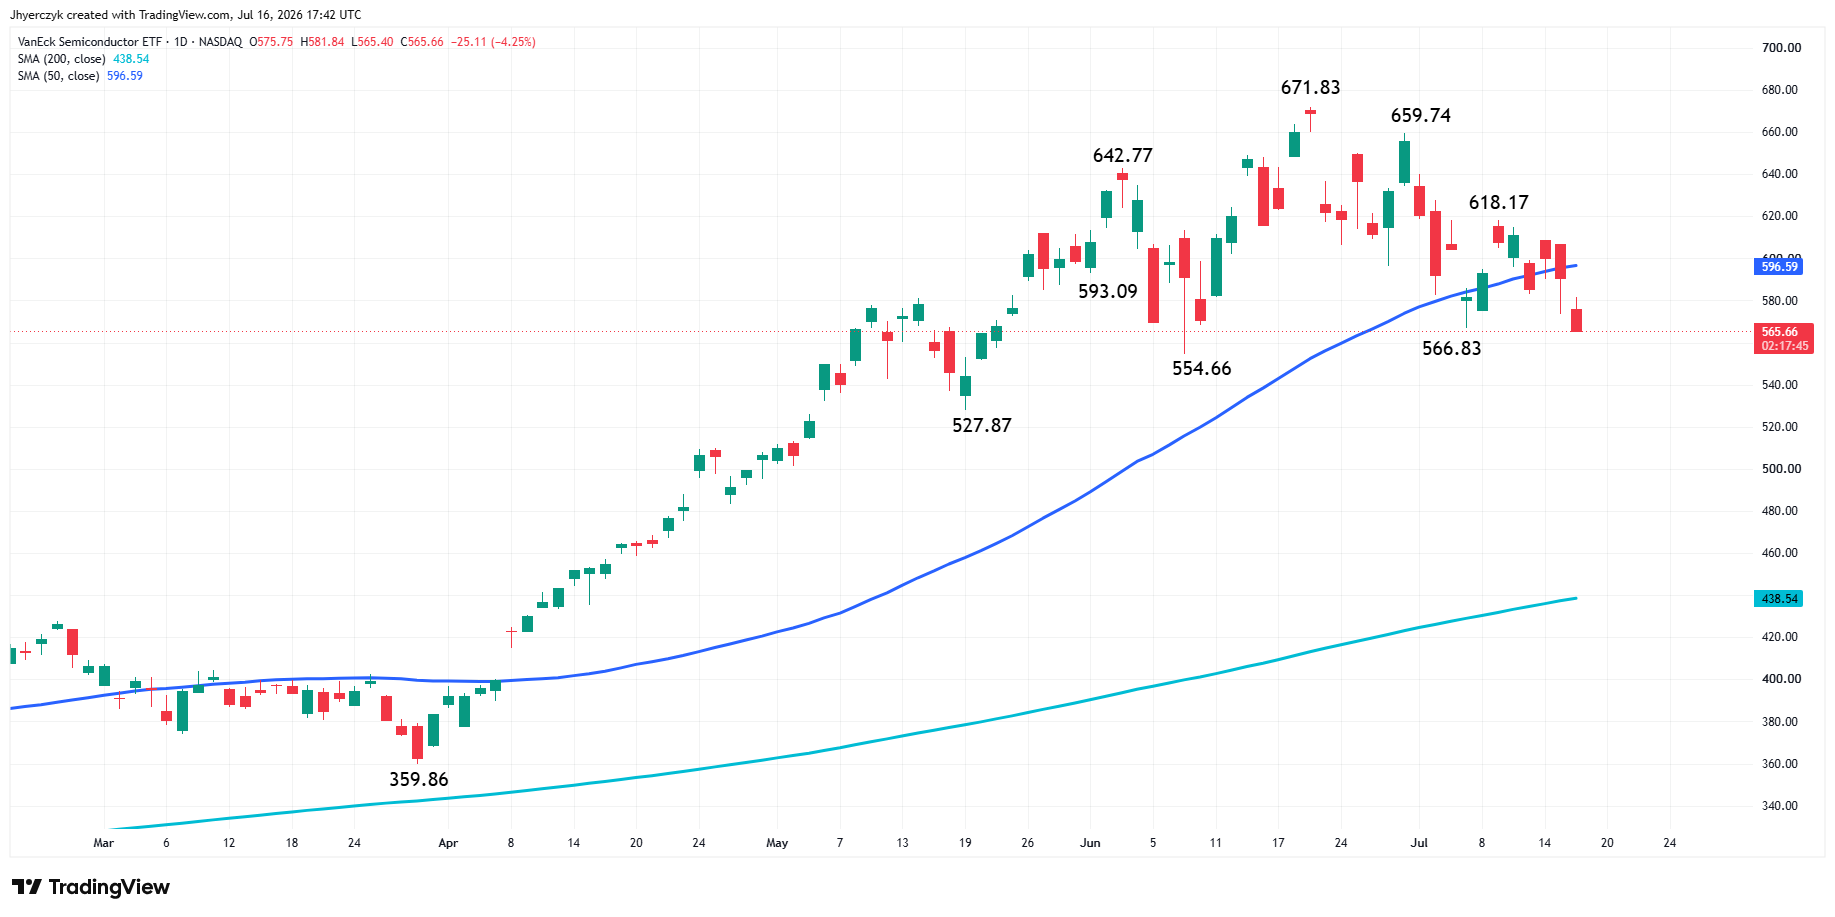
The Philadelphia Semiconductor Index dropped 3.5% Thursday with memory stocks taking the worst of it. Sandisk plunged about 10% and dragged the storage names lower with Western Digital and Seagate both giving back between 7% and 8%. TSMC fell 2.1% on another strong quarter, the second straight session of selling after a beat. AI spending is still strong and the capex forecasts keep climbing, but traders are done paying up for a trade that everyone already owns. The money is rotating, not leaving.
Retail Sales and Claims Supported the Soft Landing
June retail sales came in modest, mostly because of reduced receipts at service stations. Nonetheless, underlying consumer spending stayed healthy outside of the gas pump drag. Weekly jobless claims declined and confirmed the labor market is not deteriorating at the pace the bears need to make the recession argument. Current pricing has the Fed holding this month with September still roughly a coin flip on a hike.
Sector Scorecard
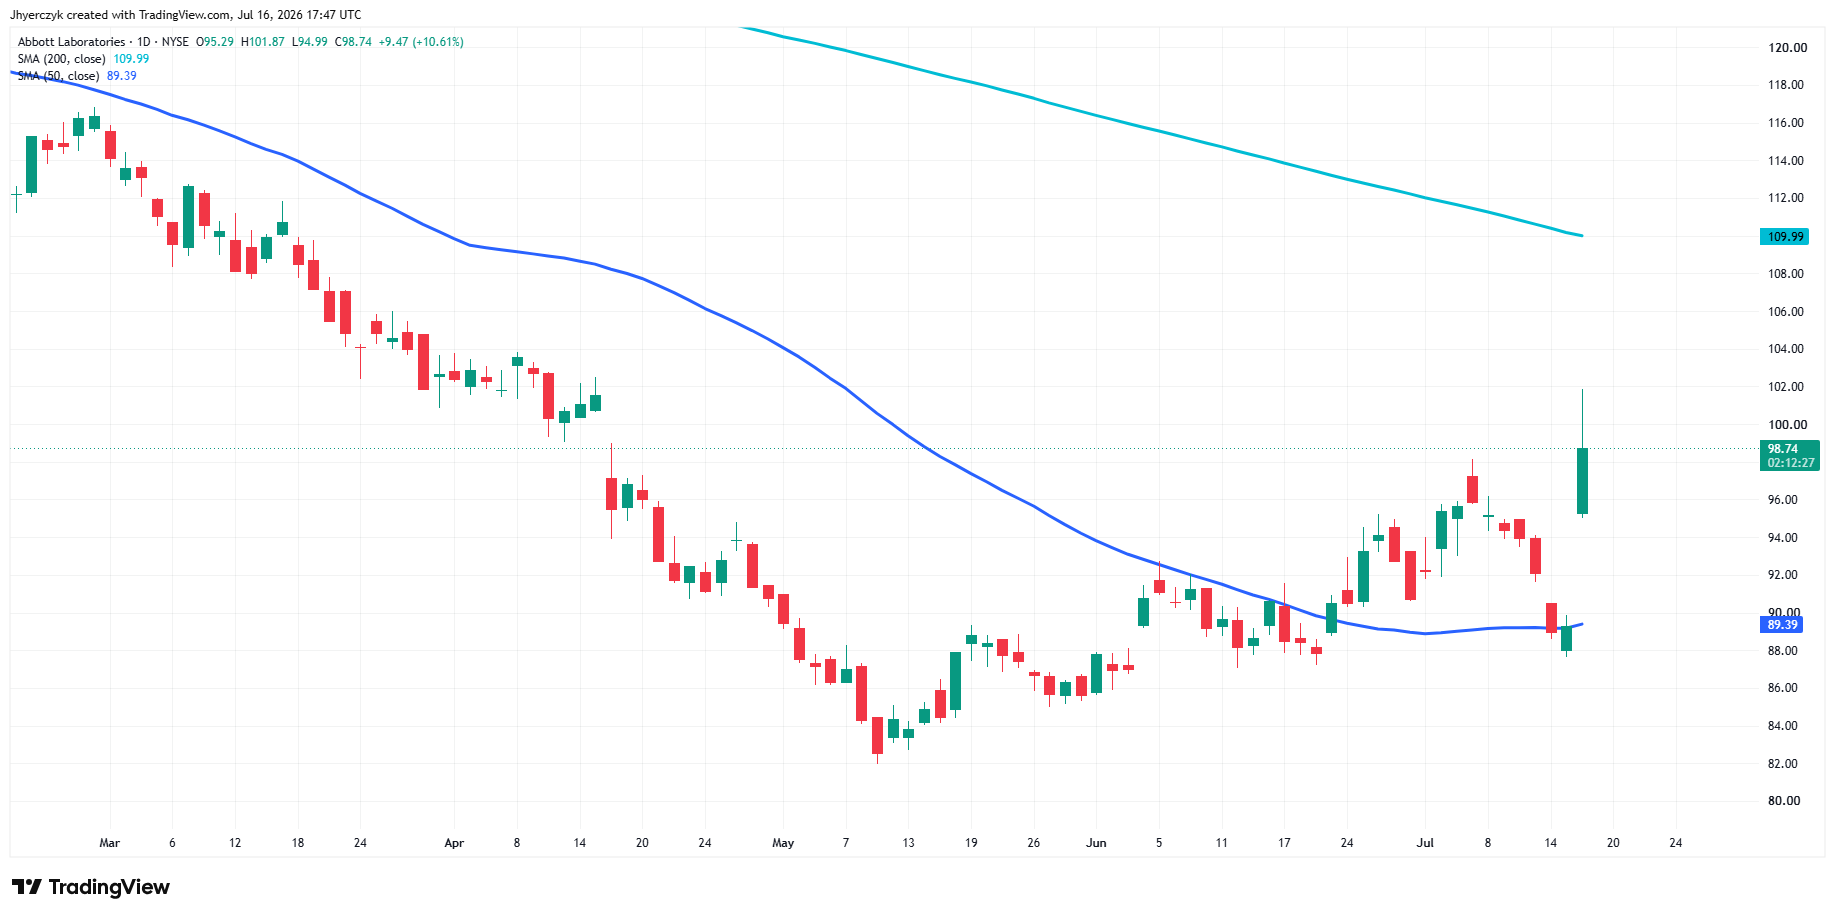
Abbott Laboratories surged 12% after beating quarterly earnings and raising its full-year profit outlook. UnitedHealth added 4.3% after raising its 2026 profit forecast. Consumer staples gained about 2%. Real estate rose about 2%. Advancing stocks narrowly led decliners on the NYSE. Declining issues led on the Nasdaq.
Stocks in the News
GE Aerospace fell 4.7% despite raising its 2026 profit forecast, extending Wednesday’s decline on the same dynamic running through the chip stocks. United Airlines slipped 1.4% as rising fuel costs continued to pressure the stock after Wednesday’s guidance warning.
What to Watch
The chip selloff is running on positioning after an extended rally, not a change in the demand picture, and the rotation into healthcare, staples, and real estate is keeping the broader market from following tech lower. Whether this stays a healthy rebalancing or turns into something wider depends on whether the next round of tech earnings can stop the bleeding in semiconductors.
The S&P 500 is inside Wednesday’s range with the 50-day moving average and short-term retracement zone underneath. The Nasdaq gapped below its 50-day moving average Thursday and is pressing the lower end of its retracement zone. The close will determine whether the S&P resolves toward the record or the support zone, and the Nasdaq needs to reclaim the 50-day moving average or the sellers take control heading into Friday.
More Information in our Economic Calendar.