Oil Took Over the Silver Trade Thursday
Silver traders spent the first half of this week focused on soft inflation and weak payrolls, and the market gave all of that back Thursday in one session. Crude climbing on the Middle East escalation rewrote the inflation outlook faster than two soft reports could establish it, and silver is paying the price with a nearly 3% decline as the dollar holds firm and Treasury yields refuse to drop. The shift happened fast enough that the June data already feels like it belongs to a different market.
At 15:03 GMT, Spot Silver (XAGUSD) is trading $56.12, down $1.66 or -2.87%.
The Inflation Story Flipped in 48 Hours
June CPI came in at 3.5% headline with core at 2.6%. PPI fell 0.3% for the month and the annual rate slowed to 5.5%. Payrolls added only 57,000 jobs. Three reports in the same week all pointing the same direction and none of it is driving this market anymore.
Silver traders already know what higher oil prices can do to the inflation outlook. Crude pushing higher on Hormuz disruptions and the Iranian naval blockade is overriding everything the June data established. The soft numbers reflected conditions before the latest escalation, and if oil holds these levels through the next collection period, the reports that matter for the Fed’s decision are going to look nothing like this week’s prints.
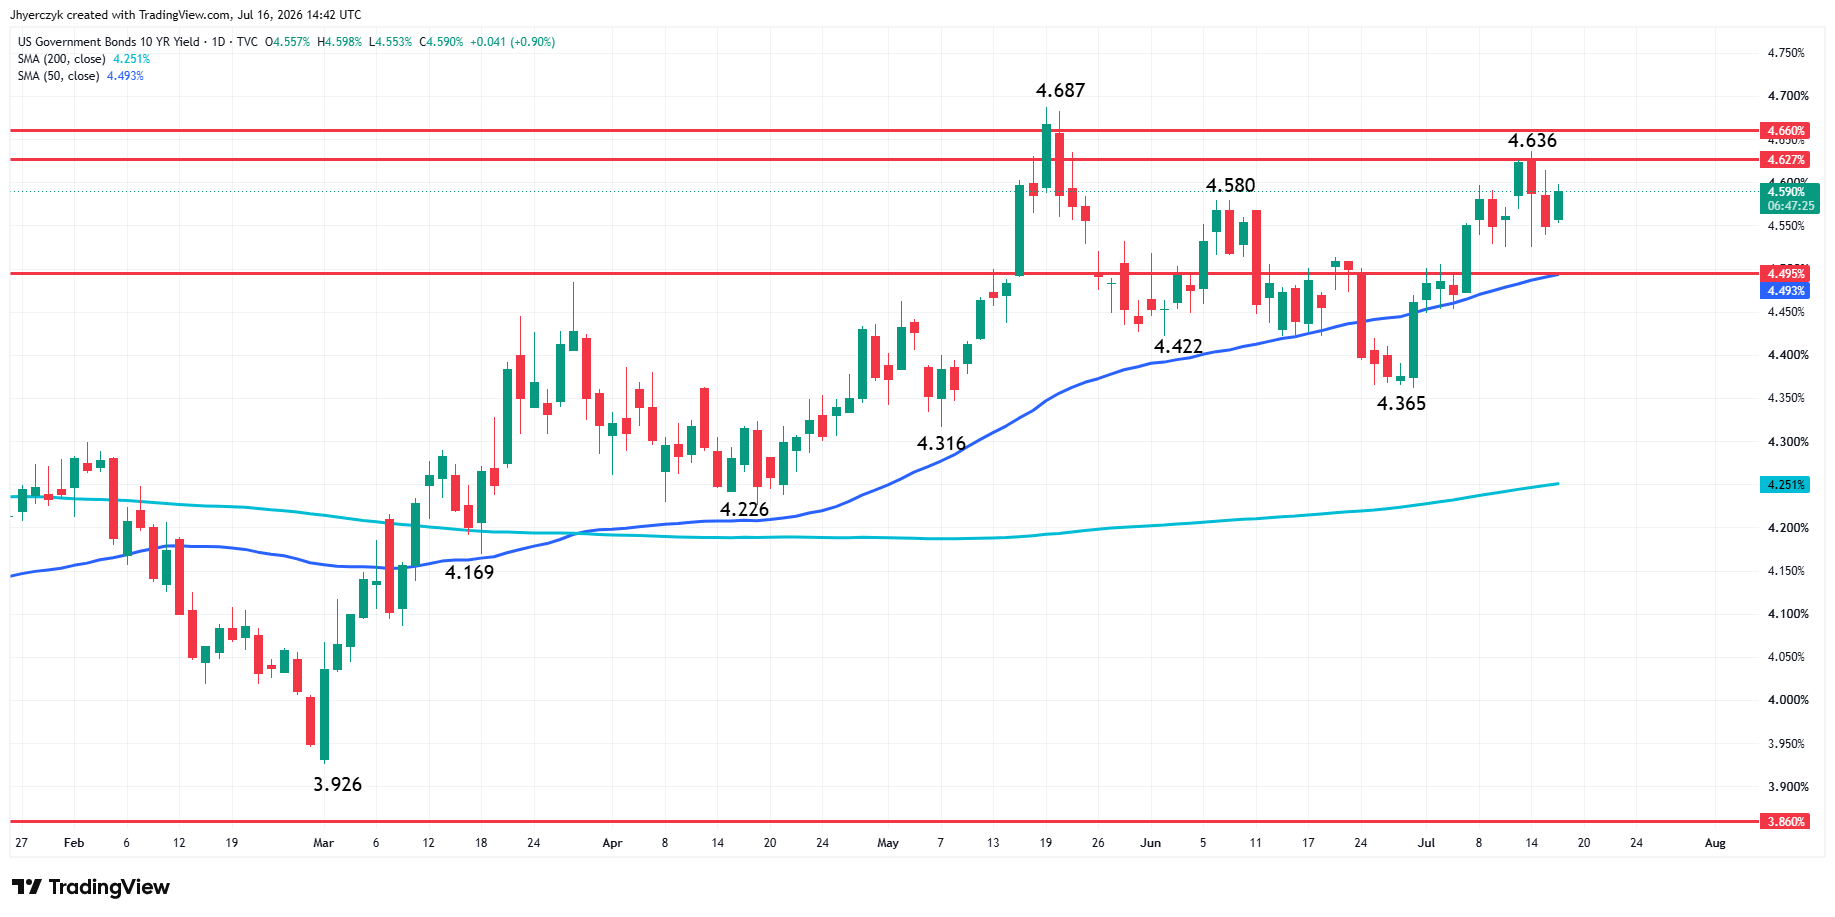
The dollar is holding firm and Treasury yields are not giving back what this week’s data should have taken from them. That combination tells you the fixed income market is not buying the rate relief trade either, and silver cannot rally when the rate picture is working against it from both directions. The data says ease. Oil says wait. The Fed is going to listen to oil.
This Is Not Just a Rate Problem for Silver
The rate story is the primary weight on this market but it is not the only one. Silver has industrial exposure that gold does not carry, and elevated energy costs are running through the same manufacturing and production channels that generate a significant portion of physical silver demand. That pressure is secondary right now and it is not the reason silver dropped 3% Thursday, but it is another input working against the bid and it will matter more if oil stays elevated long enough to slow industrial activity.
Silver Price Forecast
Every new Silver analysis as it publishes, today's technical signal and key levels, live price — on one page.
See all Silver forecastsFrom where I sit, Thursday’s decline is a market changing its priorities. The week started with traders positioning for rate relief on soft data. It is ending with oil resetting the inflation outlook and the Fed stuck between slowing employment and rising energy costs. That tension does not resolve in silver’s favor until one side of it breaks clearly, and right now the oil side has the momentum.
Daily Spot Silver (XAGUSD) Technical Analysis
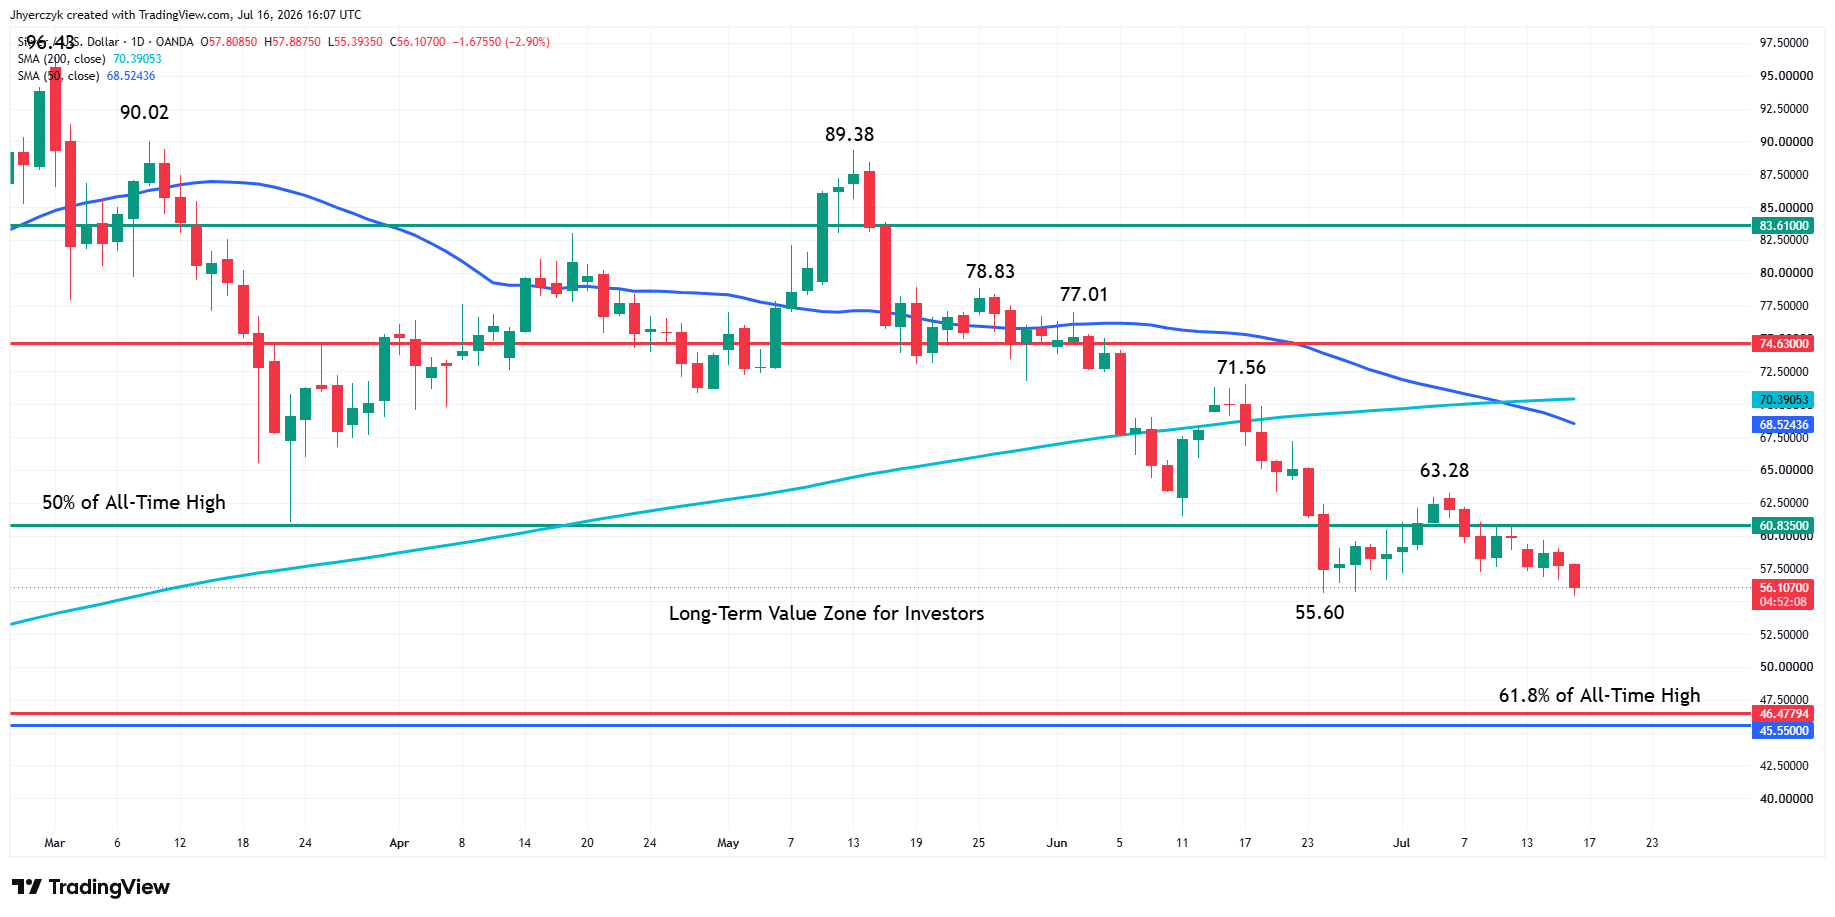
Spot Silver is under pressure as we approach the mid-session on Thursday. Sellers took out the June 24 main bottom at $55.60, reaffirming the downtrend and opening up the door to a potential steep plunge.
The market is currently trading inside the long-term value zone created by the all-time high at $121.67. Spot Silver has been trading on the weak side of its 50% level at $60.83 since June 24. For nearly three weeks, there have been signs that some traders have seen this as value, but they just couldn’t create the upside momentum needed to clear it.
Today, sellers may have regained control by taking out the swing bottom at $55.60, although, we are seeing a technical bounce from the new low at $55.39 with a rebound to $56.12.
What I think we’re looking at now is a clash between short-term trend traders and long-term investors.
The short-term trader is looking at the series of lower-tops and lower-bottoms and thinking downtrend. The long-term investor is looking at a market sitting inside 50% to 61.8% of its all-time high. The problem is, the long-term investor can keep lowering his passive bid and dragging the whole market down with him.
I can see that the daily swing chart indicates a possible change in trend to up on a trade through $63.28. A move through this level will break the pattern of lower tops. But until the long-term buyers settle on value and the short-term buyers start aggressively taking out offers, I think we’re going to see this same back and fill trading that we’ve seen over the past month.
Traders see 50% to 61.8% retracement zone form all the time on the daily chart and they seem to be more aggressive when they see them. We’re now testing 50% to 61.8% of the all-time high and I don’t sense that aggressiveness even with some silver experts still predicting $300 prices.
What to Watch
Oil is setting silver’s direction right now and that is not going to change until crude pulls back or the Middle East escalation produces a genuine de-escalation headline. The June inflation data and the weak payrolls report gave the market every reason to rally this week and silver gave it all back Thursday because the forward inflation picture changed faster than the backward-looking data could support a sustained move. The Fed is caught between soft employment and rising energy costs, and until that resolves, rallies in silver are likely to attract sellers.
Sellers broke the June 24 bottom at $55.60 Thursday and reaffirmed the downtrend, but the market is sitting inside the long-term value zone off the all-time high and bounced from $55.39. The clash between short-term trend traders pressing lower and long-term investors looking for value at these levels is the technical story, and the passive bidding that has defined this market for the past month has only produced lower lows. A trade through $63.28 would break the pattern of lower tops, but getting there requires a catalyst the data alone has not been able to deliver while oil keeps repricing the inflation outlook.
More Information in our Economic Calendar.