The S&P 500 went back and forth during the week, testing the 2250 level for support. This is a market that shows a little bit of exhaustion now, so we
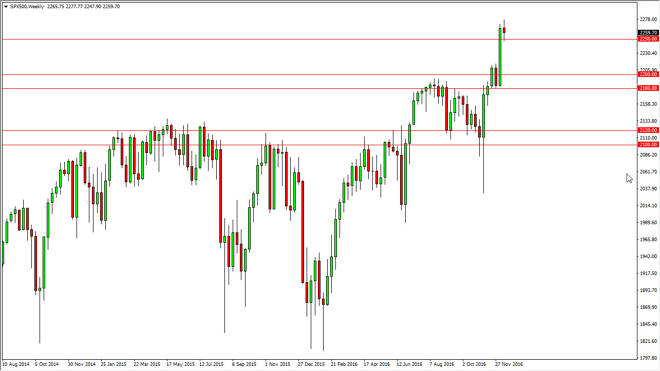
The S&P 500 went back and forth during the week, testing the 2250 level for support. This is a market that shows a little bit of exhaustion now, so we could get a bit of a pullback. Even if we break down below the 2250 handle, I feel it’s only a matter of time before buyers get involved. The 2200 level below is essentially the “floor” in this market, and I think that any bounce from there would be an excellent buying opportunity. Having said that, I also like the idea of breaking above the top of the range for the previous week in buying there as well.
Chris is a proprietary trader with more than 20 years of experience across various markets, including currencies, indices and commodities. As a senior analyst at FXEmpire since the website’s early days, he offers readers advanced market perspectives to navigate today’s financial landscape with confidence.