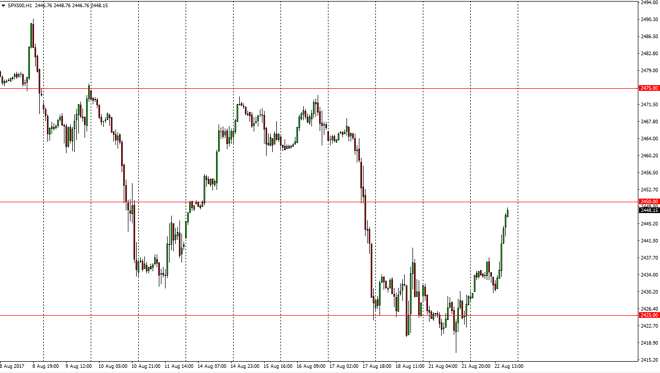
The S&P 500 initially rose during the day and then pulled back on Tuesday. There was a report coming out that perhaps there is some possible progress
The S&P 500 initially rose during the day and then pulled back on Tuesday. There was a report coming out that perhaps there is some possible progress made in tax reform in the United States, and this at the S&P 500 to the upside. The 2450 level above continues to be resistive, and I think that the market could run into a bit of trouble here. A break above 2450 should send this market to the 2470 level, and then perhaps 2475. However, I suspect that there could be a bit of a pullback from here, so be aware of that. Small position sizing will probably continue to be a necessity.
Chris is a proprietary trader with more than 20 years of experience across various markets, including currencies, indices and commodities. As a senior analyst at FXEmpire since the website’s early days, he offers readers advanced market perspectives to navigate today’s financial landscape with confidence.