


Micron Steals the Show
The S&P 500 gained 0.47% and the Nasdaq Composite climbed 0.85% on Tuesday, both hitting fresh all-time intraday highs coming off the Memorial Day break. The Dow Jones Industrial Average went the other direction, dropping 126.70 points or 0.25%.
That split tells you exactly who is driving this market. Technology names and anything tied to artificial intelligence spending carried the session. Everything else either sat still or lost ground.
Daily S&P 500 Index (SPX) Technical Analysis
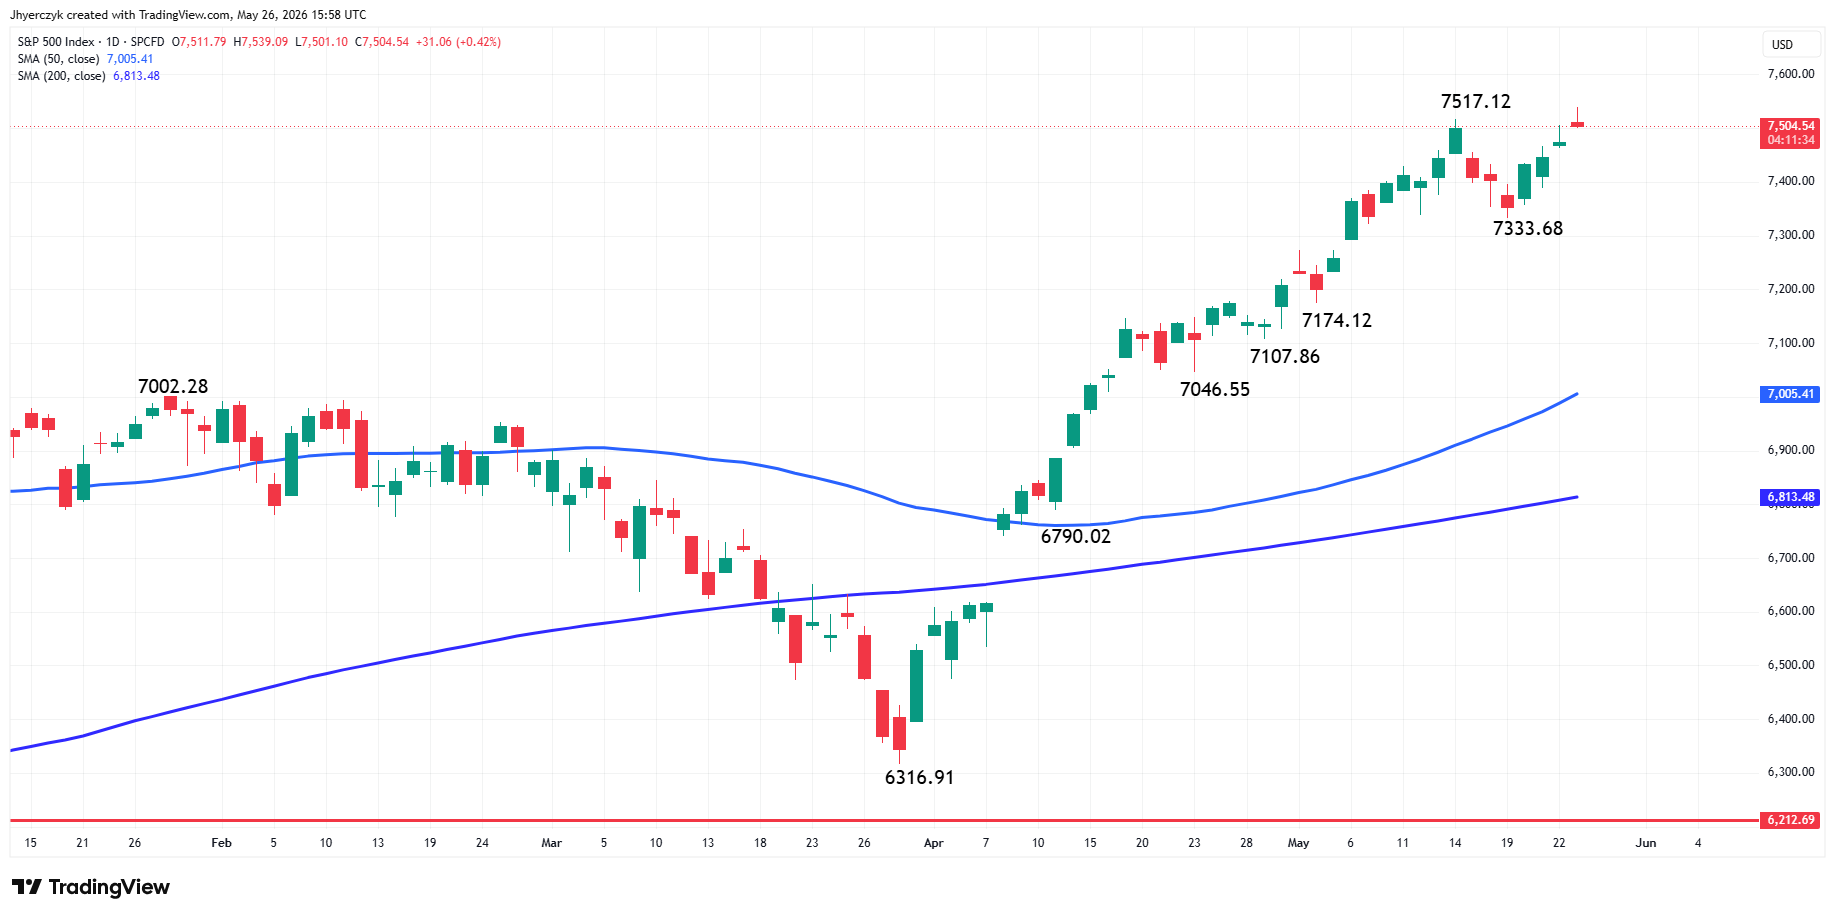
The S&P 500 Index hit a record earlier in the session on Monday at 7539.09, before pulling back below the opening price of 7511.79. That’s actually a sign of selling pressure. Another sign of weakness is the trade below the mid-point of the day 7520.10.
Making these moves at the mid-session suggests building tension that could carry over into the close. The key level at that time will be 7473.48. A close below this level will produce a potentially bearish closing price reversal top. This chart pattern will not be a change in trend, but could simply be signaling the selling is greater than the buying at current price levels.
Given the new short-term range of 7333.68 to 7506.32, this could mean a potential near-term pullback to 7420.00.
$1 Trillion on a UBS Note
Micron Technology jumped roughly 17% in a single session and crossed $1 trillion in market valuation for the first time. UBS raised its outlook on the stock and said the Street is still underestimating what artificial intelligence does for the memory chip business long term. Long-term supply agreements were part of the bull case.
NASDAQ 100 Price Forecast
Every new NASDAQ 100 analysis as it publishes, today's technical signal and key levels, live price — on one page.
See all NASDAQ 100 forecastsThe numbers behind this stock are staggering. Shares are up more than 200% in 2026. Over the last 12 months the gain is above 800%. That is not a rally. That is a repricing of what the market thinks Micron is worth in an AI-driven spending cycle.
The move pulled the rest of the memory sector with it. Seagate Technology gained about 3%. Western Digital rose around 8%. The Roundhill Memory ETF jumped roughly 12%. When one name moves 17% and drags the entire sector higher, that is the market telling you the AI infrastructure trade is not slowing down.
Record Highs and Strikes in the Same Session
The S&P 500 posted a new record and the United States carried out military strikes in southern Iran on the same day. That combination should not make sense but this market has been ignoring geopolitical risk for weeks.
President Trump said Monday that talks aimed at ending the conflict were proceeding nicely. Hours later U.S. Central Command confirmed self-defense strikes targeting missile launch sites and Iranian boats that were reportedly attempting to place mines. Spokesman Tim Hawkins said the military showed restraint during the current ceasefire period.
July West Texas Intermediate crude oil futures were still down around 2% near $93 a barrel. Spot Brent crude oil traded roughly 4% higher on the day near $100 a barrel. The oil market is confused and equities are ignoring it.
The Streak Is Real but Narrow
Last week the S&P 500 gained 0.9% and posted its longest weekly winning streak since late 2023. The Dow added 2.1%. The Nasdaq gained 0.5%, marking its seventh weekly gain in eight weeks.
The problem is what is underneath the streak. A handful of mega-cap tech names are doing all the work. Tuesday’s session made that obvious. The Nasdaq climbed nearly a full percent while the Dow dropped. That is not broad strength. That is concentration risk dressed up as a bull market.
Ron Albahary, chief investment officer at LNW, said investors appear highly optimistic that the war could end soon and economic conditions could normalize quickly. He also warned there is a real struggle between confidence in the spending wave that has supported markets and concerns that the underlying economy remains fragile.
Rate Hike Talk Is Back
Here is the number that should worry the bulls more than anything happening in Iran. Traders are now pricing in a 13% chance of a Federal Reserve rate hike in July. A month ago that number was 0.9%.
Oil prices are still running well above where they started the year and inflation has not gone away. The market celebrated falling crude last week but crude is still elevated. That is not a setup where the Federal Reserve starts cutting. That is a setup where the conversation shifts from when do they cut to whether they raise.
Consumers Are Starting to Feel It
The Conference Board reported that consumer confidence slipped in May. The index dropped to 93.1 from a revised 93.8 in April. The number came in slightly above estimates but the direction is down.
Growing concerns about inflation and the impact of Middle East tensions on energy costs are showing up in how consumers feel about the economy. That matters because consumer spending is the largest piece of GDP and confidence that trends lower eventually shows up in the data.
What to Watch
The market is running on two things right now and they are pulling in opposite directions. AI spending is pushing mega-cap tech to record highs and that is carrying the indexes. But oil prices are still elevated, rate hike odds are climbing from near zero to 13% in a month, and consumer confidence is slipping. That combination works until it does not and right now the concentration in a handful of names makes the entire rally vulnerable to a single rotation out of tech.
The S&P 500 hit 7539.09 and pulled back below its opening price. A close below 7473.48 produces a potentially bearish closing price reversal top and opens the door to a pullback toward 7420.00. That is the level that tells you whether buyers are still in control or whether Tuesday’s new high was the exhaustion move.
More Information in our Economic Calendar.