
Advertisement
Advertisement
Technical Analysis Natural Gas for November 30, 2015
By:
Natural gas prices continued to break down on Friday as warm weather continues to be forecast to over most of the East Coast of the United States. During
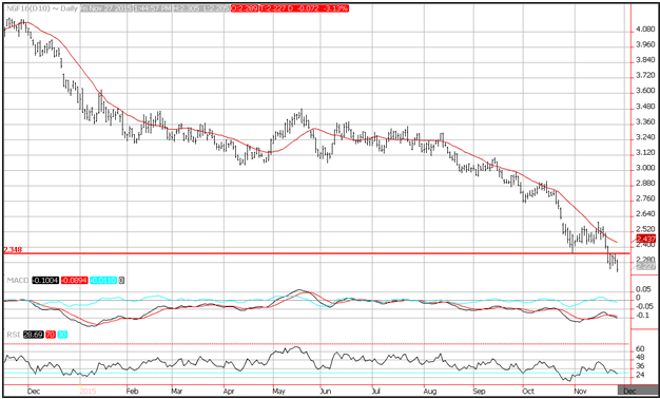
Natural gas prices continued to break down on Friday as warm weather continues to be forecast to over most of the East Coast of the United States. During the summer storage facilities built up a cushion of 4 trillion cubic feet of gas which now, combined with milder than expected weather, is putting downward pressure on prices.
Prices through the weekly lows at 2.35, and are poised to test the 2012 lows at 1.90. Resistance is seen near the 20-day moving average at 2.437. Momentum has turned negative as the MACD (moving average convergence divergence) index recently generated a sell signal. This occurs as the spread (the 12-day moving average minus the 26-day moving average) crosses below the 9-day moving average of the spread. The index moved from positive to negative territory confirming the sell signal. The RSI (relative strength index) moved lower with price action reflecting accelerating negative momentum while print a reading of 28, which is below the oversold trigger level of 30 and could foreshadow a correction.
About the Author
David Beckerauthor
David Becker focuses his attention on various consulting and portfolio management activities at Fortuity LLC, where he currently provides oversight for a multimillion-dollar portfolio consisting of commodities, debt, equities, real estate, and more.


Advertisement