
Advertisement
Advertisement
Technical Checks For Gold, Silver & WTI Crude: 21.04.2017
By:
GOLD In spite of the Gold’s $1270 TL breakout propelled it towards five-month high, the yellow-metal failed to surpass another downward slanting
GOLD
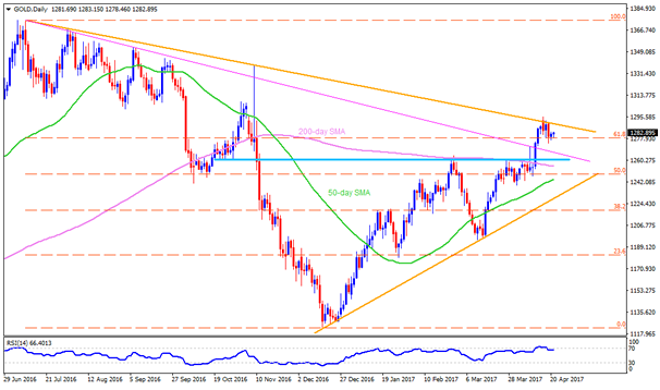
In spite of the Gold’s $1270 TL breakout propelled it towards five-month high, the yellow-metal failed to surpass another downward slanting trend-line, at $1291 now, and witnessed pullback during its consequent trading sessions. At present the bullion prices are struggling between $1271 and $1291 ahead of the French election which is likely to provide noticeable market moves. However, overbought RSI is indicating more of the downside than the otherwise and hence a dip below $1271 can quickly fetch the quote towards $1260-61 horizontal-line, breaking which 200-day SMA level, around $1255, gains importance. In case of the precious-metal’s further south-run below $1255, the 50-day SMA level of $1243, followed by $1235-33 region, may grab sellers’ attention. On the contrary, a clear break of $1291 trend-line could accelerate the metal’s north-run towards $1302, $1308 and $1311 consecutive resistances. Given the safe-haven successfully trades beyond $1311, it becomes capable enough to target $1330 and the $1338 numbers towards north.
SILVER
Unlike Gold, which is trading in a range and signals decline, Silver is currently testing 50-day SMA support level of $17.90, which triggered its bounce-off during early-month, and indicates a U-turn towards $18.10 & $18.30 resistances. Should the white-metal clears $18.30 mark, it can aim for $18.30 & $18.65 before pushing buyers to look for $19.00 round-figure. Though, the bullion’s additional up-moves above $19.00 could be confined by resistance-line of a four-month old ascending trend-channel, at $19.20 now. Meanwhile, a daily closing below $17.90 could further strengthen the bearish bias and can fetch prices to $17.70 & $17.55 but the $17.35-30 support-confluence, including 100-day SMA & channel’s lower-line, is more likely to disappoint sellers. In case if the industrial-input drops below $17.30, the $17.00 and $16.80 are expected following supports that it can avail.
WTI CRUDE OIL
Crude is currently struggling in the $50 – $51.00 range with oversold RSI pointing towards its bounce to $51.50-55 on the upside break. If the fuel rises beyond $51.55, the $52.00 – $52.10 horizontal-line may try to limit its following up-moves, clearing which it becomes wise to expect $52.50 & $52.80 to appear on the chart prior to targeting $53.15-20 resistance-zone. Alternatively, a dip below $50.00 psychological magnet may fetch the quote to $49.50-45 line-support and then to $49.00. In course of the Crude’s extended downturn below $49.00, the $48.70 and $48.40 can please short-term traders before pleasing the Bears with $47.85.
Cheers and Safe Trading,
Anil Panchal
About the Author
Anil Panchalauthor
An MBA (Finance) degree holder with more than five years of experience in tracking the global Forex market. His expertise lies in fundamental analysis but he does not give up on technical aspects in order to identify profitable trade opportunities.


Advertisement