
Advertisement
Advertisement
The Best Trading Opportunity Today – NZD/USD – November 9, 2015
By:
The best trade opportunity today is a potential counter-trend breakout to the upside by the NZD/USD. Last week, the Forex pair finished near its low,
The best trade opportunity today is a potential counter-trend breakout to the upside by the NZD/USD. Last week, the Forex pair finished near its low, which suggested the possibility of further selling pressure today. So far the selling pressure hasn’t emerged, suggesting that profit-taking and short-covering is guiding the market.
Since there aren’t any major economic reports today, counter-trend traders may have the advantage. Additionally, many of the bearish investors may decide to take to the sidelines ahead of Friday’s major U.S. retail sales report.
The current inside move on the daily chart suggests trader indecision and impending volatility. In addition, today’s session begins with the NZD/USD down 17 sessions from the .6896 top and 11 sessions down from the .6864 top. This puts the market in the window of time for a potential reversal. Additionally, today’s session begins with the NZD/USD inside a major retracement zone that could provide support.
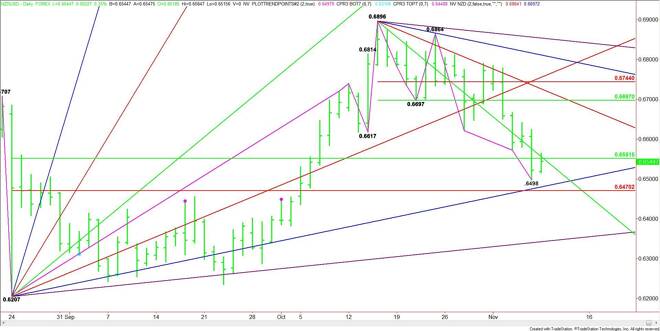
Daily Chart
The main trend is down according to the daily swing chart. The main range is .6207 to .6896. Its retracement zone is .6551 to .6470. Last week’s low was .6498. Currently, the NZD/USD is testing the 50% level at .6551.
A major downtrending angle from the .6896 top comes in at .6556. Since the main trend is down, .6551 to .6556 is likely to act like resistance on the first test, however, the angle at .6556 is also a potential trigger point for an acceleration to the upside.
I like the long side today even though it is a counter-trend move because of the upside potential over the near-term. A sustained move over .6556 will indicate the presence of buyers. If this creates enough upside momentum then the short-term 50% level at .6697 becomes the primary upside target.
Hourly Chart
The Hourly chart with the key daily chart levels placed on it show the market is currently straddling the key levels. Earlier in the session, the NZD/USD rallied through the daily levels, only to run into selling at .6565. The move couldn’t be sustained and the market broke back under .6551.
This next move has to take out .6556 and then attract enough buying to hold above .6551. If you can’t get your price then look for another breakout on the hourly chart above the swing cop at .6565.
Volume is light so don’t hang on too long if support fails since this is a pure momentum play.
Watch the price action at .6556 and .6551 today. A sustained move over .6556 will indicate the presence of buyers. A sustained move under .6551 will signal the presence of sellers.
About the Author
James Hyerczykauthor
James Hyerczyk is a U.S. based seasoned technical analyst and educator with over 40 years of experience in market analysis and trading, specializing in chart patterns and price movement. He is the author of two books on technical analysis and has a background in both futures and stock markets.


Advertisement