December U.S. Dollar Index futures rallied Tuesday, driven by increased appetite for risky assets like stocks and with higher U.S. Treasury yields. A
December U.S. Dollar Index futures rallied Tuesday, driven by increased appetite for risky assets like stocks and with higher U.S. Treasury yields. A plunge in the Euro also helped boost the dollar. The single-currency rallied after European Central Bank President Mario Draghi reiterated that further easing was on the table for December.
Despite the gain, buyers still appeared to be a little tentative ahead of Thursday’s Bank of England monetary policy committee meeting and Friday’s major U.S. Non-Farm Payrolls report. Economists predict the jobs report will show that the economy added about 179K jobs in October.
Meeting or exceeding this number would increase the odds of a December rate hike by the U.S. Federal Reserve.
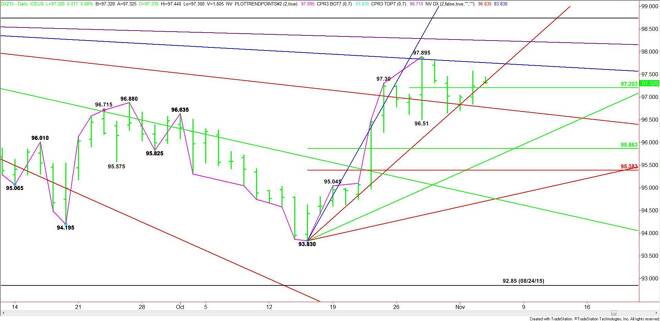
The main trend is up according to the daily swing chart, however, momentum has been to the downside since October 28 with prices consolidating inside the 97.895 to 96.51 range. The mid-point or pivot price of this range is 97.20. This price is essentially controlling the short-term direction of the market.
Yesterday’s close was 97.24. This puts the index on the strong side of the pivot at 97.20. A sustained move over this level will indicate the presence of buyers. Crossing to the strong side of the steep uptrending angle at 97.33 will put the index in a bullish position. This could trigger a rally into the long-term downtrending angle at 97.76.
The angle at 97.76 is the last potential resistance angle before the 97.895 short-term top. Taking out this level will signal a resumption of the uptrend. It could also trigger an acceleration into the next downtrending angle at 98.25.
A sustained move under 97.20 will signal the presence of sellers. The daily chart opens up to the downside under this angle with the next major near-term target a 50% level at 95.86.
Watch the price action and read the order flow at 97.20 today. Trader reaction to this level will tell us whether the buyers or sellers are in control today.
James Hyerczyk is a U.S. based seasoned technical analyst and educator with over 40 years of experience in market analysis and trading, specializing in chart patterns and price movement. He is the author of two books on technical analysis and has a background in both futures and stock markets.