



Dollar Firms as Sticky Inflation Reinforces Cautious Fed Outlook
The dollar gained modestly in early U.S. trading on May 27, 2026, as a hotter-than-expected April U.S. Consumer Price Index continued to cast doubt on near-term cuts by the Federal Reserve. Shelter and energy showed persistent pressures in April after the U.S.-Iran ceasefire allowed oil shipments through the Strait of Hormuz to return partially to normal levels. Pressure on the dollar had eased somewhat in recent weeks as markets digested the conditional nature of the U.S.-Iran truce. Yet today’s inflation reading reminded markets that the path to monetary easing remains uncertain.
The euro suffered from the dollar’s advance and a confusing set of recent European Central Bank remarks on the pace of rate cuts. The British pound struggled against the dollar as the Bank of England reiterated its data-dependent stance as UK economic data came in mixed and the global economy remained unsettled.
Expect currencies to continue in flux as market participants absorb the latest U.S. data and statements by Federal Reserve officials over the next few days.

DXY Holds $99.08 – Blue Ascending Channel Breakout Steady
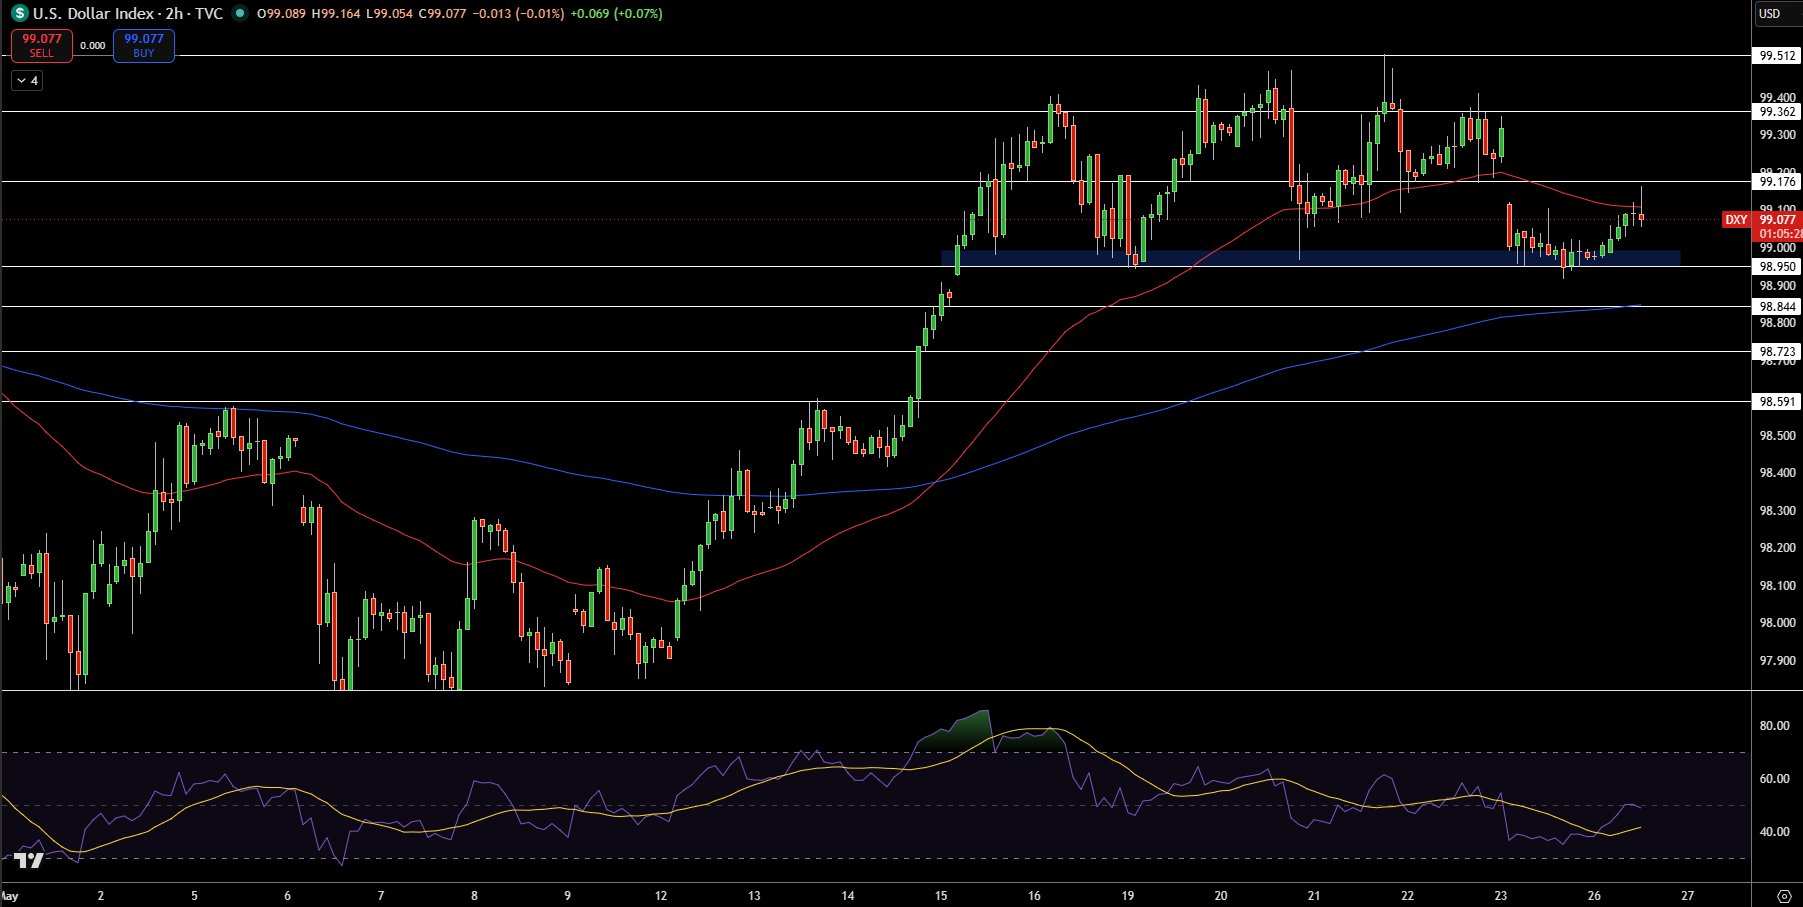
Dollar Index (DXY) 99.08 (2h), blue Ascending Channel, Blue floor defended (green candles) 98.90, red MA50. Bullish continuation bodies printing higher lows, above 99.00 pivot, rejecting white descending trendline from April.
RSI > 52 (positive momentum, not overbought). Next Fib levels $99.17-$99.36. $98.97 marked on volume as strong area of support. Bullish structure above $98.97 in a clean Ascending Channel towards $99.41-$99.51, printing higher lows in short term trend.
Trade Idea: Buy $99.08 targeting $99.36, stop $98.80.
GBP/USD Climbs to $1.3454 – Rising Channel Floor Defense
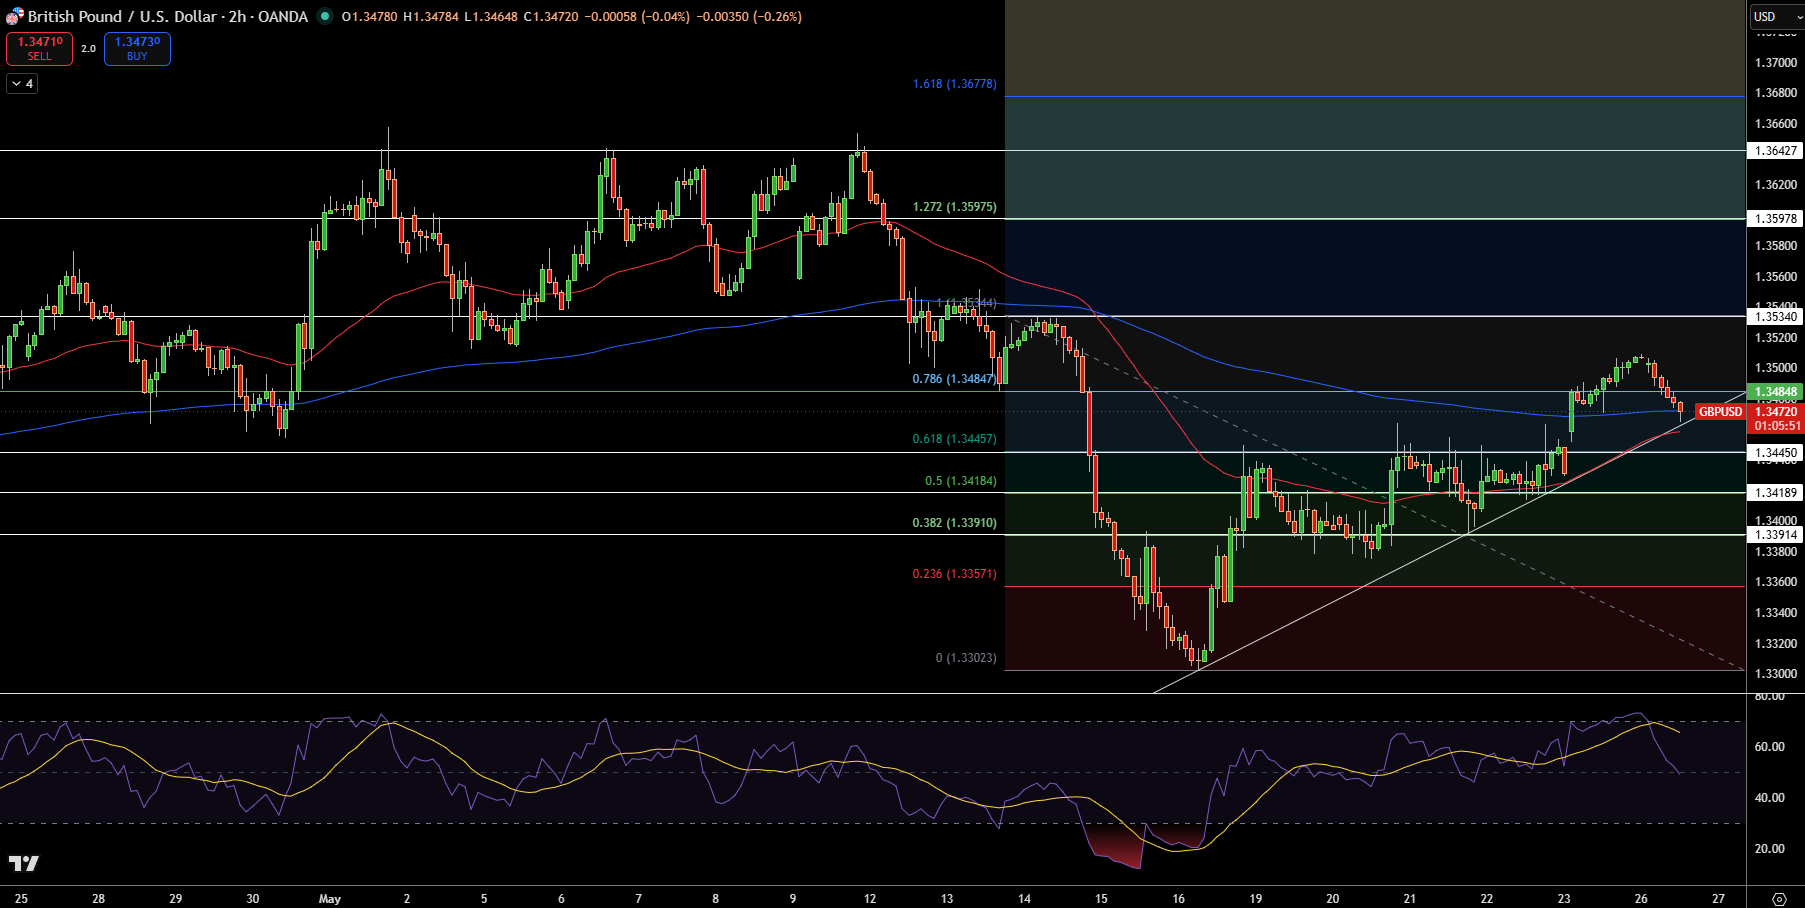
GBP/USD 1.3454 (2h), green wicks defended white ascending trendline & 0.382 fib levels ~1.339. Red MA ~1.345 resistance level above bullish structure in bullish Ascending Channel. Red/green candles with higher lows, bullish buyer absorption with higher lows above $1.339.
GBP/USD Price Forecast
Every new GBP/USD analysis as it publishes, today's technical signal and key levels, live price — on one page.
See all GBP/USD forecastsNeutral bullish momentum, RSI ~ 52. Bullish $1.339 volume level. $1.348-$1.353 resistance level above.
Trade Idea: Buy $1.3454 targeting $1.353, stop $1.339.
EUR/USD Rejects $1.164 – White Descending Trendline Pressure
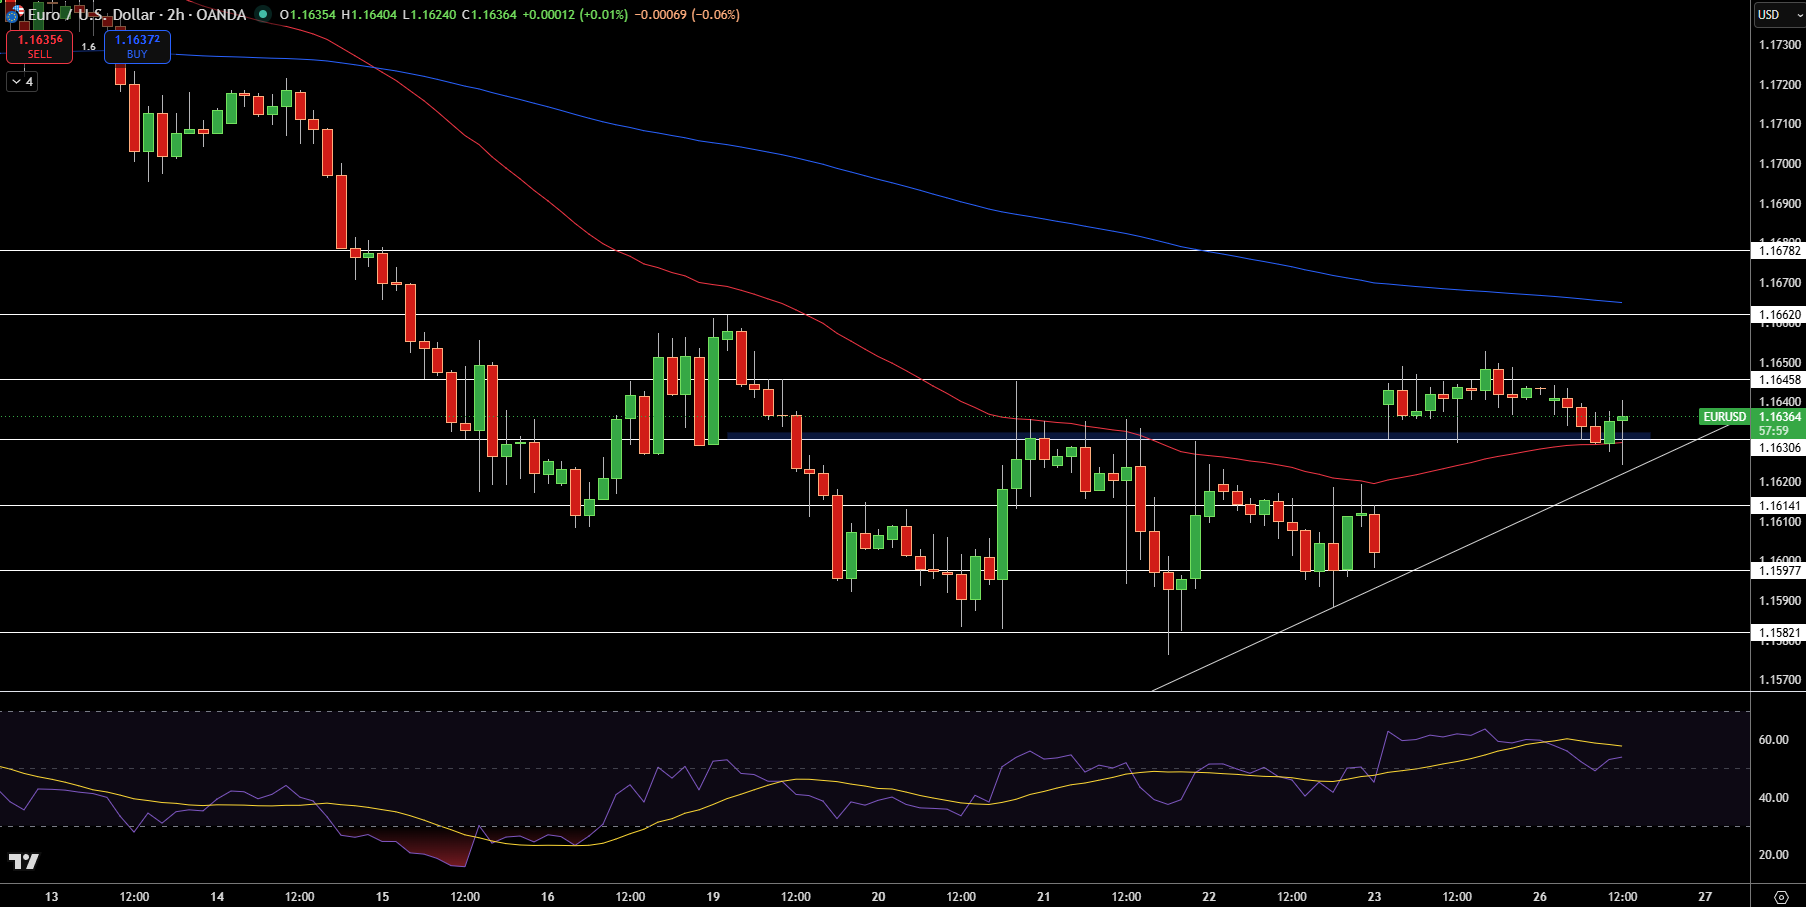
EUR/USD 1.1642 (2h), red candles rejected white descending trendline resistance & red MA ~1.166. Bearish rejection wicks with lower highs above distribution above blue support floor ~1.158. RSI< 48 (bearish momentum fading). $1.162 marked on volume as strong supply zone.
Next support $1.158-$1.156. Bearish structure below $1.166 as tests a blue ascending channel floor in bearish trend, $1.158-$1.156.
Trade Idea: Sell $1.1642 targeting $1.158, stop $1.166.


