The S&P 500 rallied above 7,700 as strong AI-related earnings and broad gains in technology and semiconductor stocks improved the market sentiment. The sharp increase in the ISM Manufacturing PMI also showed that factory demand and production remain strong. The lower oil prices, softer Treasury yields and easy financial conditions added further support. But the high PMI price indexes and rapid credit growth may keep inflation pressure elevated. This article examines the latest AI earnings, ISM data, financial conditions and technical levels that may shape the next move in the S&P 500.
Agustina Maria Patti, Financial Markets Strategist at Exness, commented:
Strong earnings are giving investors reasons to be confident, especially as AI spending continues to benefit both technology companies and businesses that support the build-out behind it. At the same time, stronger economic activity comes with a catch: price pressures remain high, which could keep the Fed cautious. Markets are therefore likely to stay focused on earnings, inflation and bond yields for clues on whether the current momentum can last.
S&P 500 Hits Record High as AI Earnings and Chip Stocks Rally
The S&P 500 gained over 2.5% this week to rally above the 7,700 level. Nasdaq and Dow Jones also rally after forming a strong support at the key levels. The stock rally this week was broad throughout the market. The advancing stocks outnumbered declining stocks by almost three to one on both the NYSE and Nasdaq.
This rally was due to strong gains by companies with AI connections. Palantir Technologies Inc. (PLTR) rose by over 29% following the increase in its annual revenue guidance. Caterpillar Inc. (CAT) increased by 5.6% and produced strong momentum in the Dow Jones. The company expects stronger demand for equipment to power AI data centres. This forecast indicates that investment in AI remains robust for technology and industrial companies.
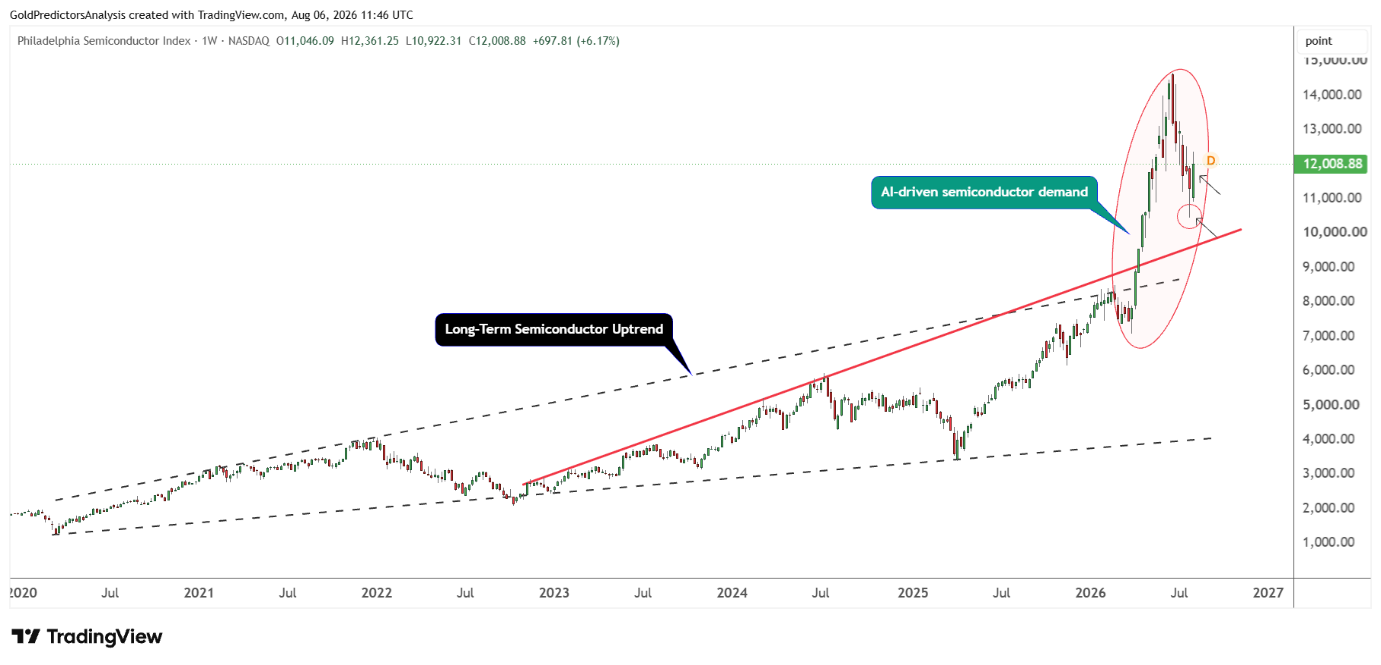
Semiconductor stocks also bounced back strongly. The Philadelphia Semiconductor Index jumped over 6% to break the 12,000 level. The overall price structure for the Philadelphia Semiconductor index remains strongly bullish and points to further upside.
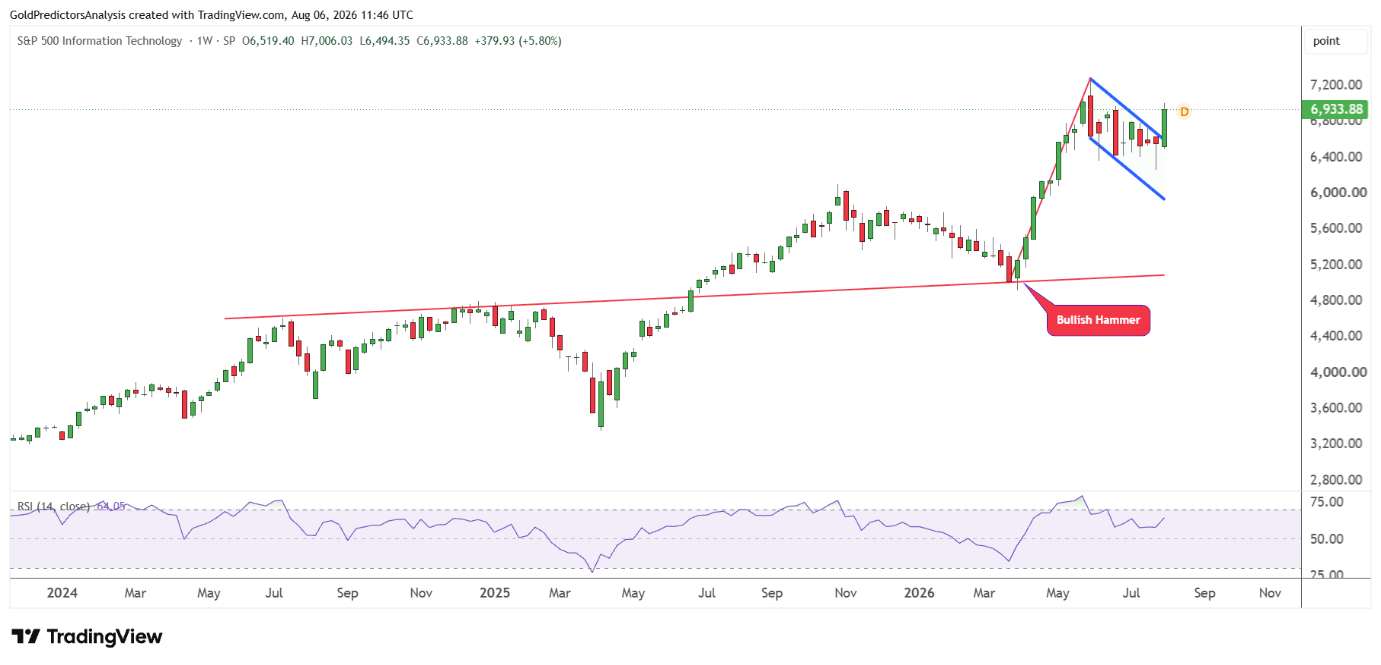
On the other hand, the S&P 500 information technology index gained over 5% and broke the 6,900 level. The chart below shows strong constructive price action for the information technology index and points to further upside. The breakout from the bull flag formation indicates a sustained rally in the index.
The strength in these sectors indicates that the broader market is seeing strong corporate earnings. Approximately 85.2% of the S&P 500 companies reported beating earnings estimates. This is still well above the long term average of 67.5% and it explains the recent rally.
S&P 500 Price Forecast
Every new S&P 500 analysis as it publishes, today's technical signal and key levels, live price — on one page.
See all S&P 500 forecastsStrong ISM Manufacturing Data Supports the S&P 500 Outlook
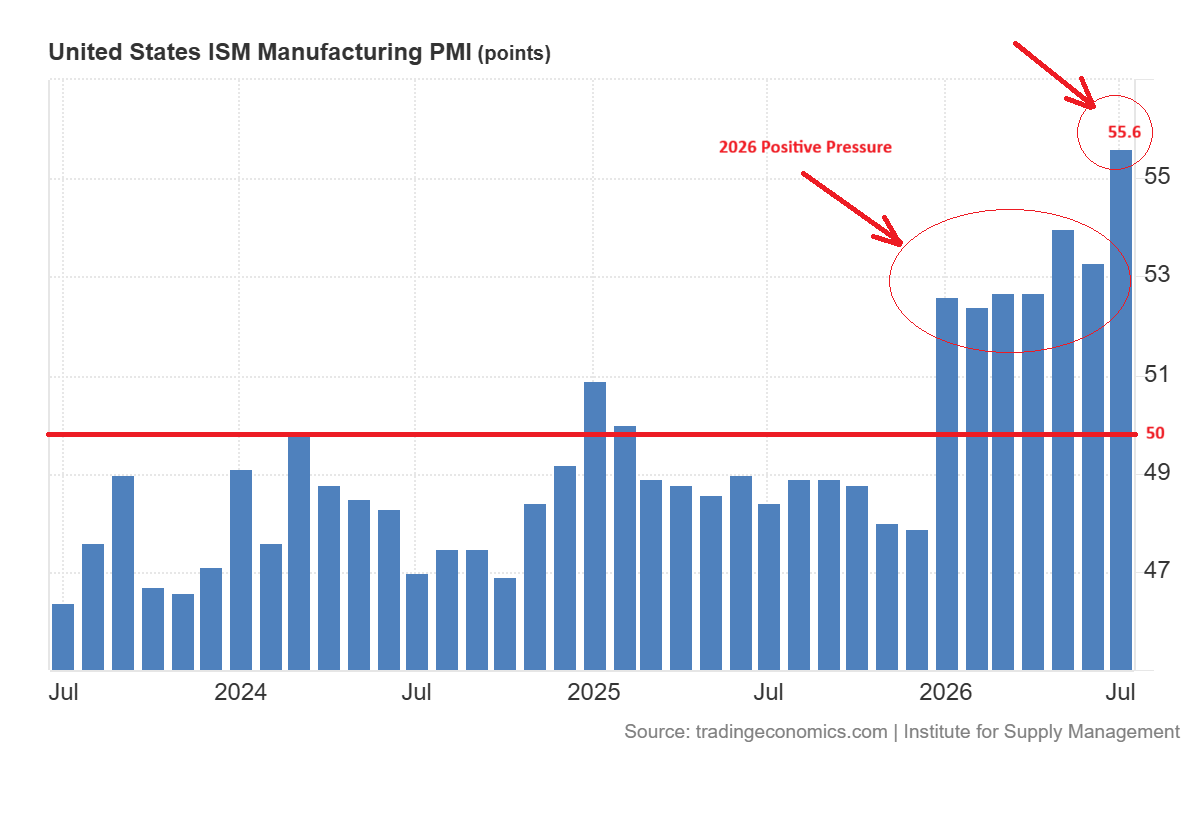
The U.S. manufacturing activity improved sharply in July. The ISM manufacturing PMI increased to 55.6 from 53.3 as seen in the chart below. It was strongest reading since May 2022.
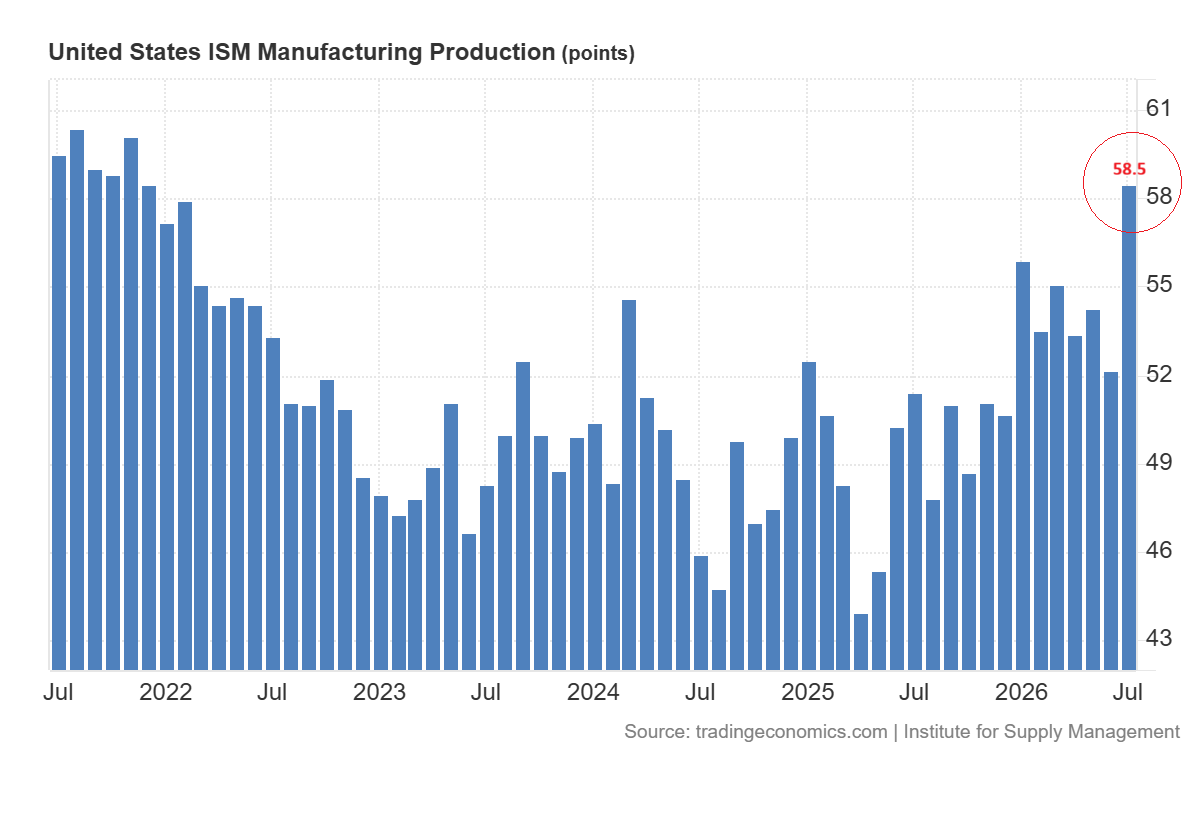
The production index also surged to 58.5 while new orders increased to 56.7. These figures show stronger factory demand and output. This improvement may support the earnings of industrial, machinery and technology companies in S&P 500.
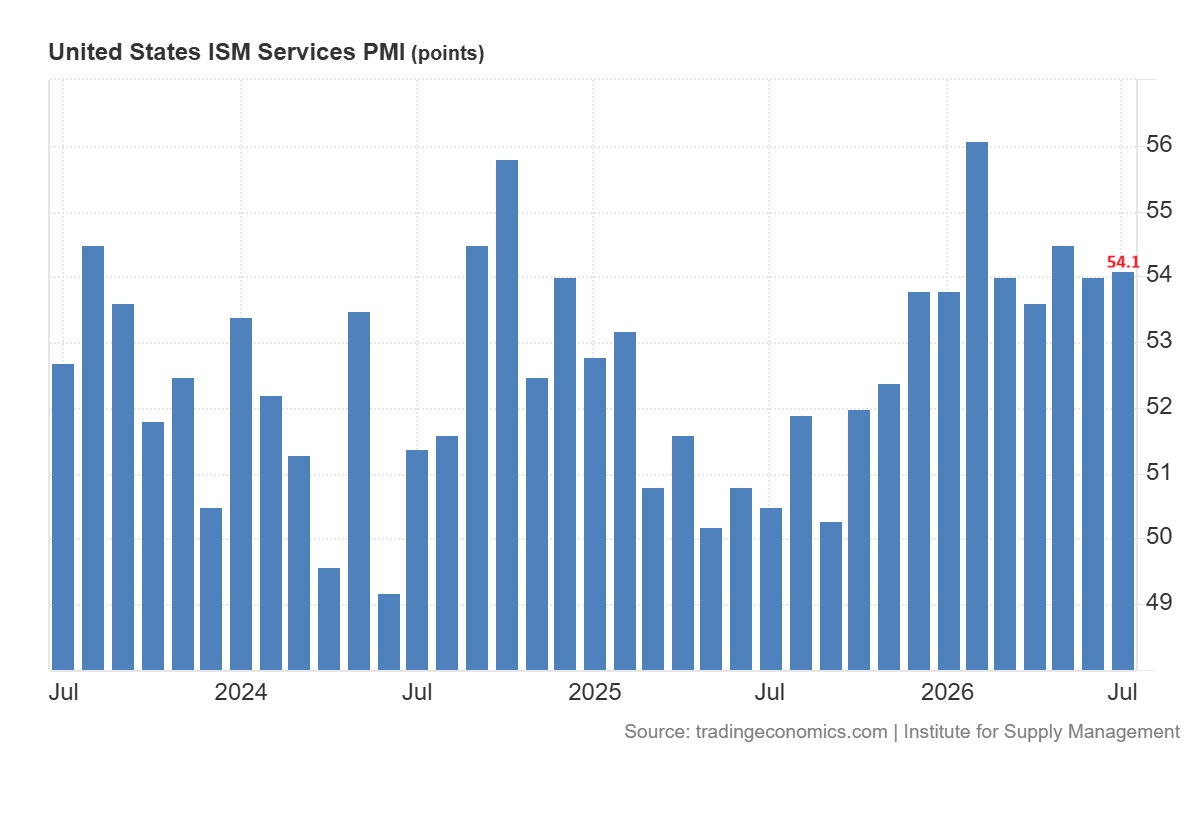
The services sector also remained strong. The ISM services PMI edged up to 54.1 while business activity climbed to 59.1 and new orders reached 57.2.
But the price pressures remained high. The services price index increased to 70.3, while manufacturing prices stood at 71.1.
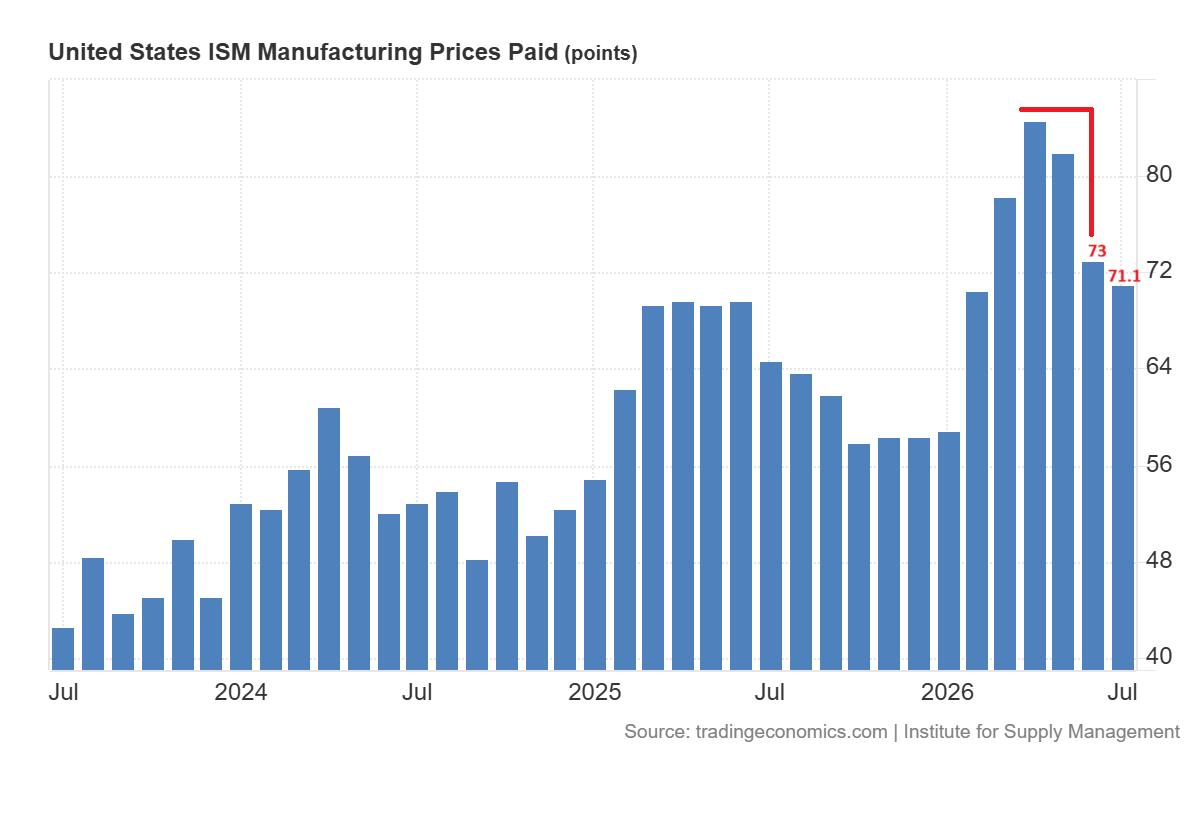
These price pressures indicate that any correction in the US Treasury yields may be short lived. This means that the stronger business activity supports the move toward 8,000 in S&P 500 but inflation concerns could cause a temporary pullback.
Falling Oil Prices and Easy Credit Support the S&P 500 Rally
The price of crude oil fell by over 5% last week on the expectations that Iran may reach a peace agreement. The deal may reopen the Strait of Hormuz and curb the risk of further supply disruptions in the region. The reduced oil prices could also help to relieve the inflationary pressures. That pushed the likelihood of a Fed rate hike in September down to 56% and sent Treasury yields down.
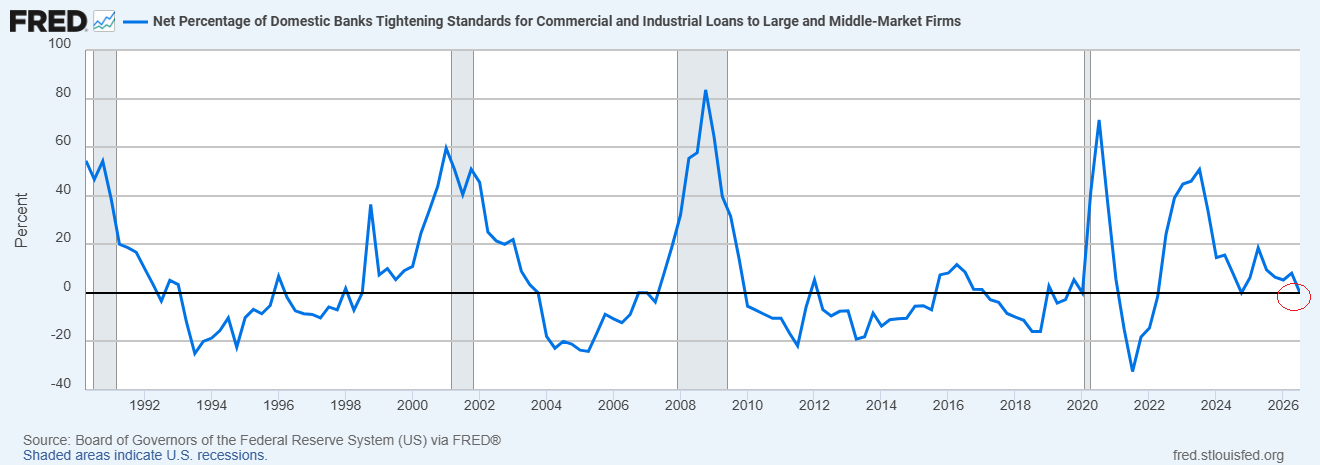
Financial conditions are also supportive. The Feds’ loan officer survey indicated that the share of banks tightening standards for commercial and industrial loans dropped to zero.
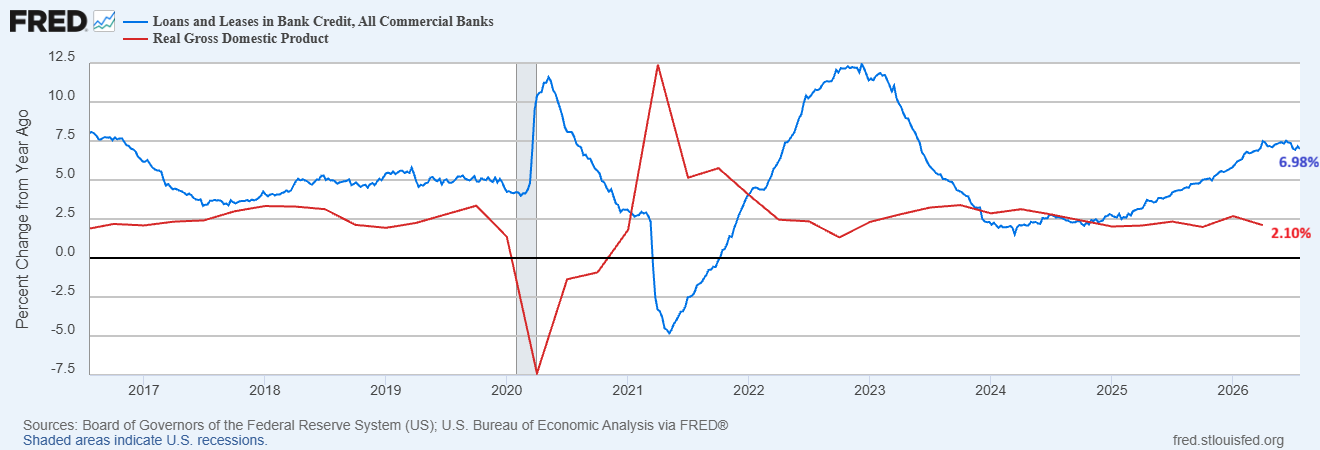
The growth rate of commercial bank loans and leases is also growing at an annual rate of 6.98%. The equity prices and business activity can be supported by the easier access to credit. But the credit growth can be more than economic growth, which can still place inflation under pressure. The chart below shows that the gap between credit growth and GDP growth implies monetary inflation of nearly 5%.
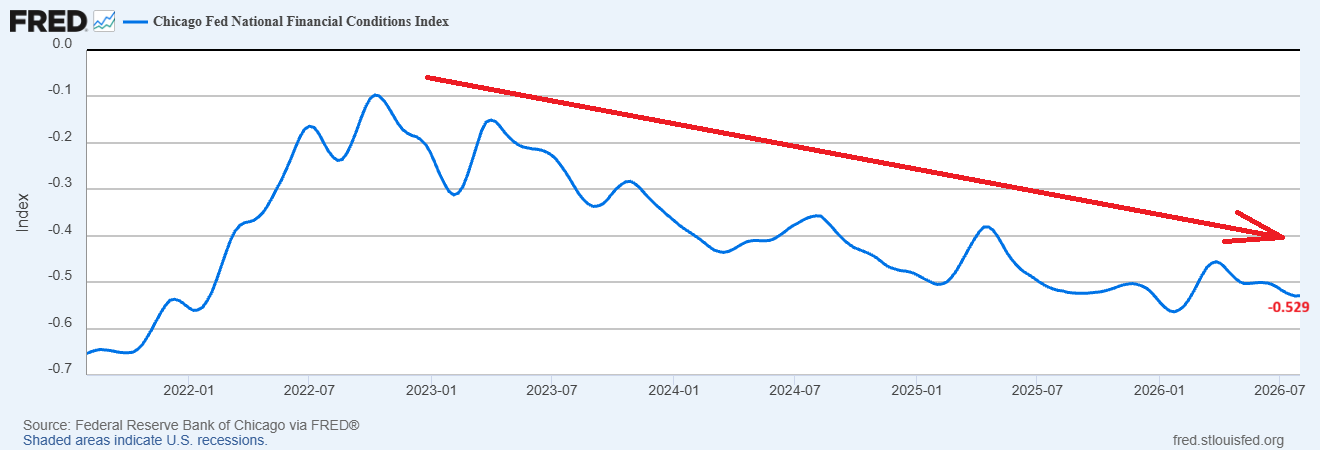
The Chicago Fed National Financial Conditions Index also indicates easy financial conditions as the index dropped to -0.529.
Despite these easy financial conditions, the Bitcoin price has not recovered above the $70,000 level and has consolidated in bearish pattern. As long as the bitcoin price remains below the $70,000, the risk of another decline is possible. This weakness suggests that investors are still curious about the speculative assets.
S&P 500 Technical Analysis: Breakout Above 7,620 Targets 8,000
From technical perspective, the S&P 500 has broken the triangle formation that started to develop in June 2026. This triangle was broken at the 7,570 level and pushed the index above the pivotal 7,620 area. This breakout has opened the door for strong and quick move toward the 8,000 level in the S&P 500.
This bullish structure is supported by the formation of an inverted head and shoulders pattern in June 2025 and then the formation of a V-shaped recovery in March 2026, followed by a strong bullish structure.
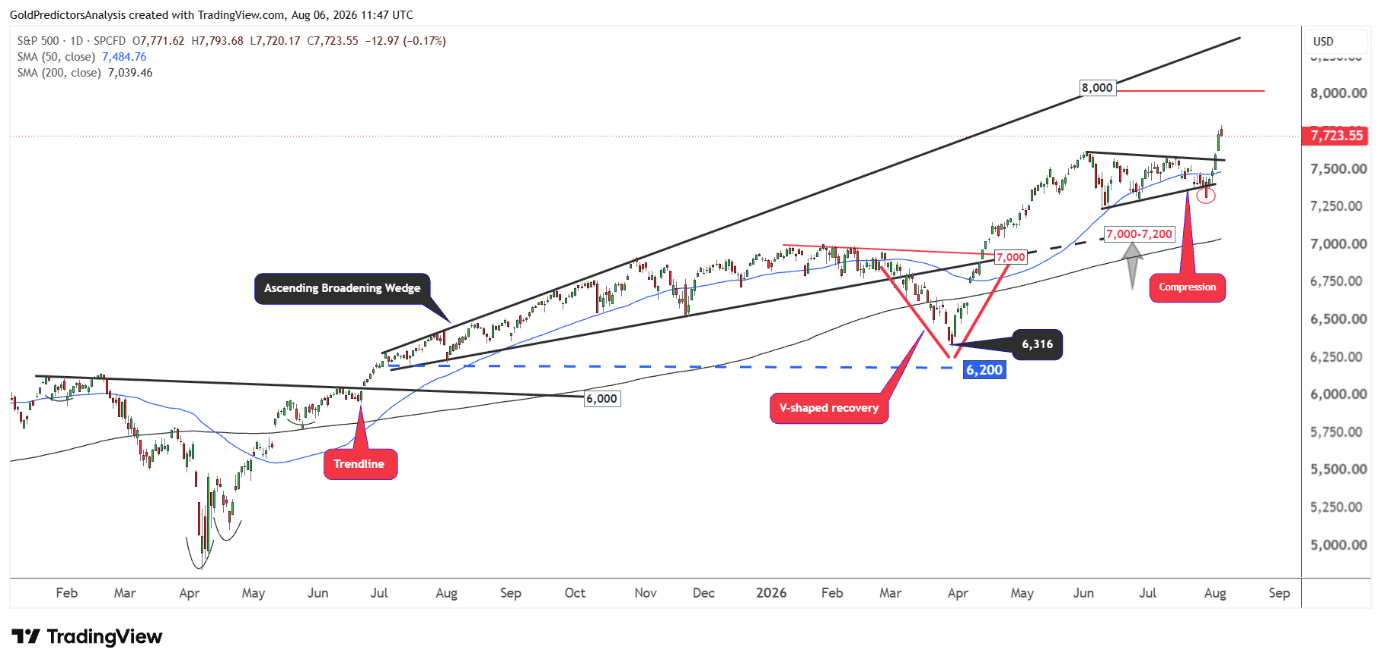
The recent consolidation in June and July pushed the price slightly below the triangle pattern on July 29, 2026 but it immediately recovered. This immediate recovery indicates that the S&P 500 has strong bullish technical momentum.
Moreover, the index remains above the 50 and 200 SMAs and both SMAs remain in strong bullish trends. This indicates continued upside momentum in the index.
The short term compression in the index is clearly observed on the daily chart as the move below this triangle on July 29 was a fake breakdown. After this, the index recovered strongly and broke above 7,620.
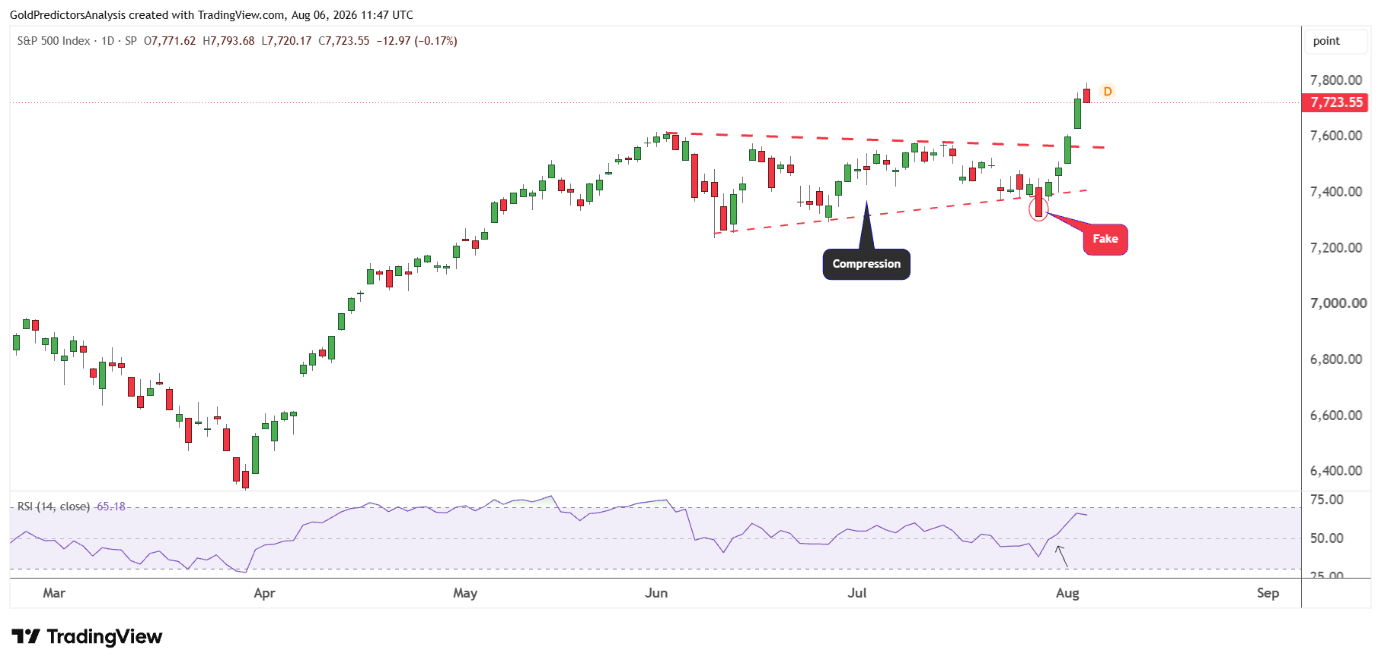
The index may pull back slightly toward the breakout area at the 7,620 level before initiating the next move toward the 8,000 level. But the break above Wednesday’s high may continue the short term rally. The RSI has also recovered above the midline, which points to positive momentum in the index.
What is Next?
The outlook for the S&P 500 remains bullish in the short term. The strong earnings from AI-related companies continue to support the investor confidence. The recovery in semiconductor and technology stocks also shows strong market leadership. The broad market participation adds strength to the rally as gains are not limited to few large companies.
The macroeconomic environment also supports the index. The lower oil prices have reduced inflation fears and weakened expectations for a September rate hike. The lower Treasury yields and easy credit conditions may support business activity and equity prices. The strong ISM data also support the earnings outlook but the elevated price pressures may keep the Fed cautious. The strong credit growth could keep inflationary pressure elevated. The weakness in Bitcoin below $70,000 also shows that investors remain cautious about speculative assets.
The technical breakout above the 7,620 level has opened the way to 8,000. The bullish moving averages and RSI recovery support this target. The short term pullback toward 7,620 would be normal after the strong rally. But a sustained drop below 7,570 would weaken the bullish outlook and increase the risk of deeper correction.