



The ASX 200 Index ended the week on firmer footing, helped by strong rebounds in miners, banks and declining Australian yields. Still, I’d keep my expectations measured until the Index can secure a weekly close above 8,800.

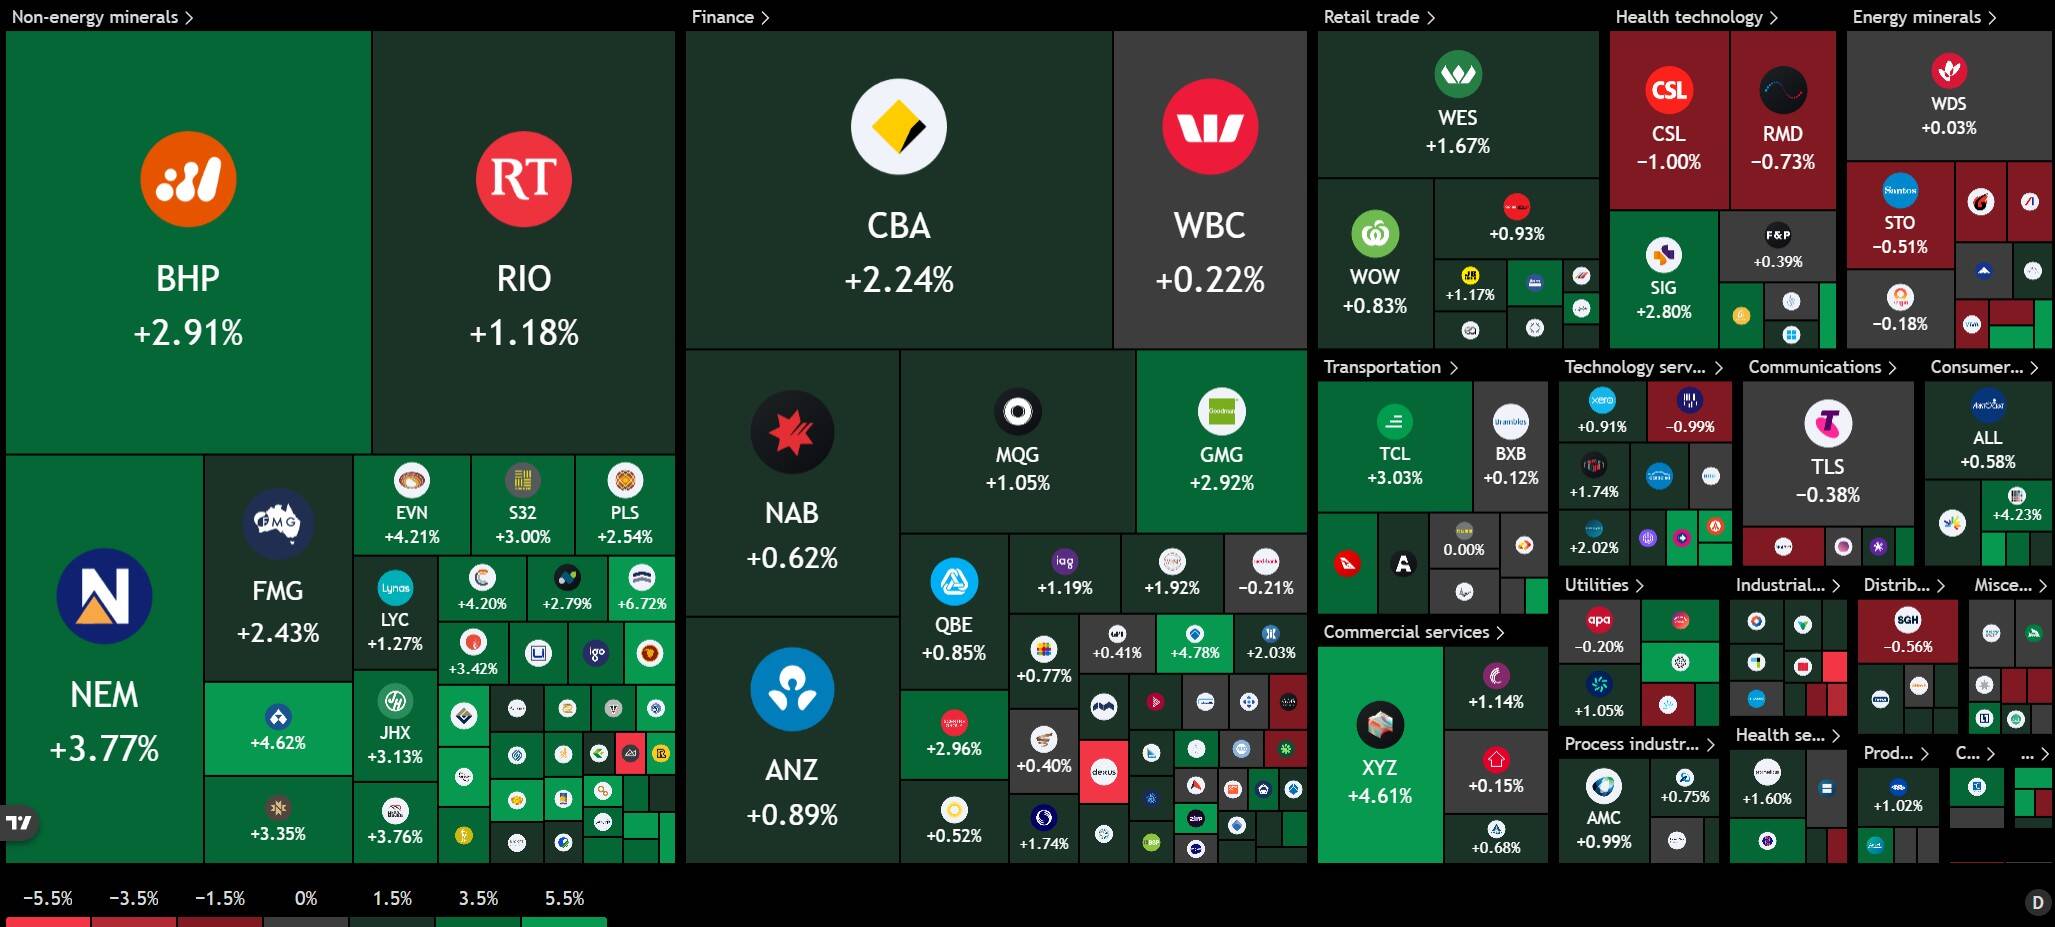
Heat Map Shows Miners And Banks Doing The Heavy Lifting
We see BHP up 2.91%, NEM up 3.77%, FMG up 2.43%, RIO up 2.43%, CBA up 2.24% and GMG up 2.92%. What a way to end the week in Australian equities trading. It’s a healthy broad heavyweight push. Indeed, miners and gold names led gains, with firmer copper and stronger bullion helping the move. But the energy sector was a laggard today, as crude softened. Healthcare is soft with CSL down 1.00% and RMD down 0.73%.
ASX 200 Index Gets Help From Australian Yields
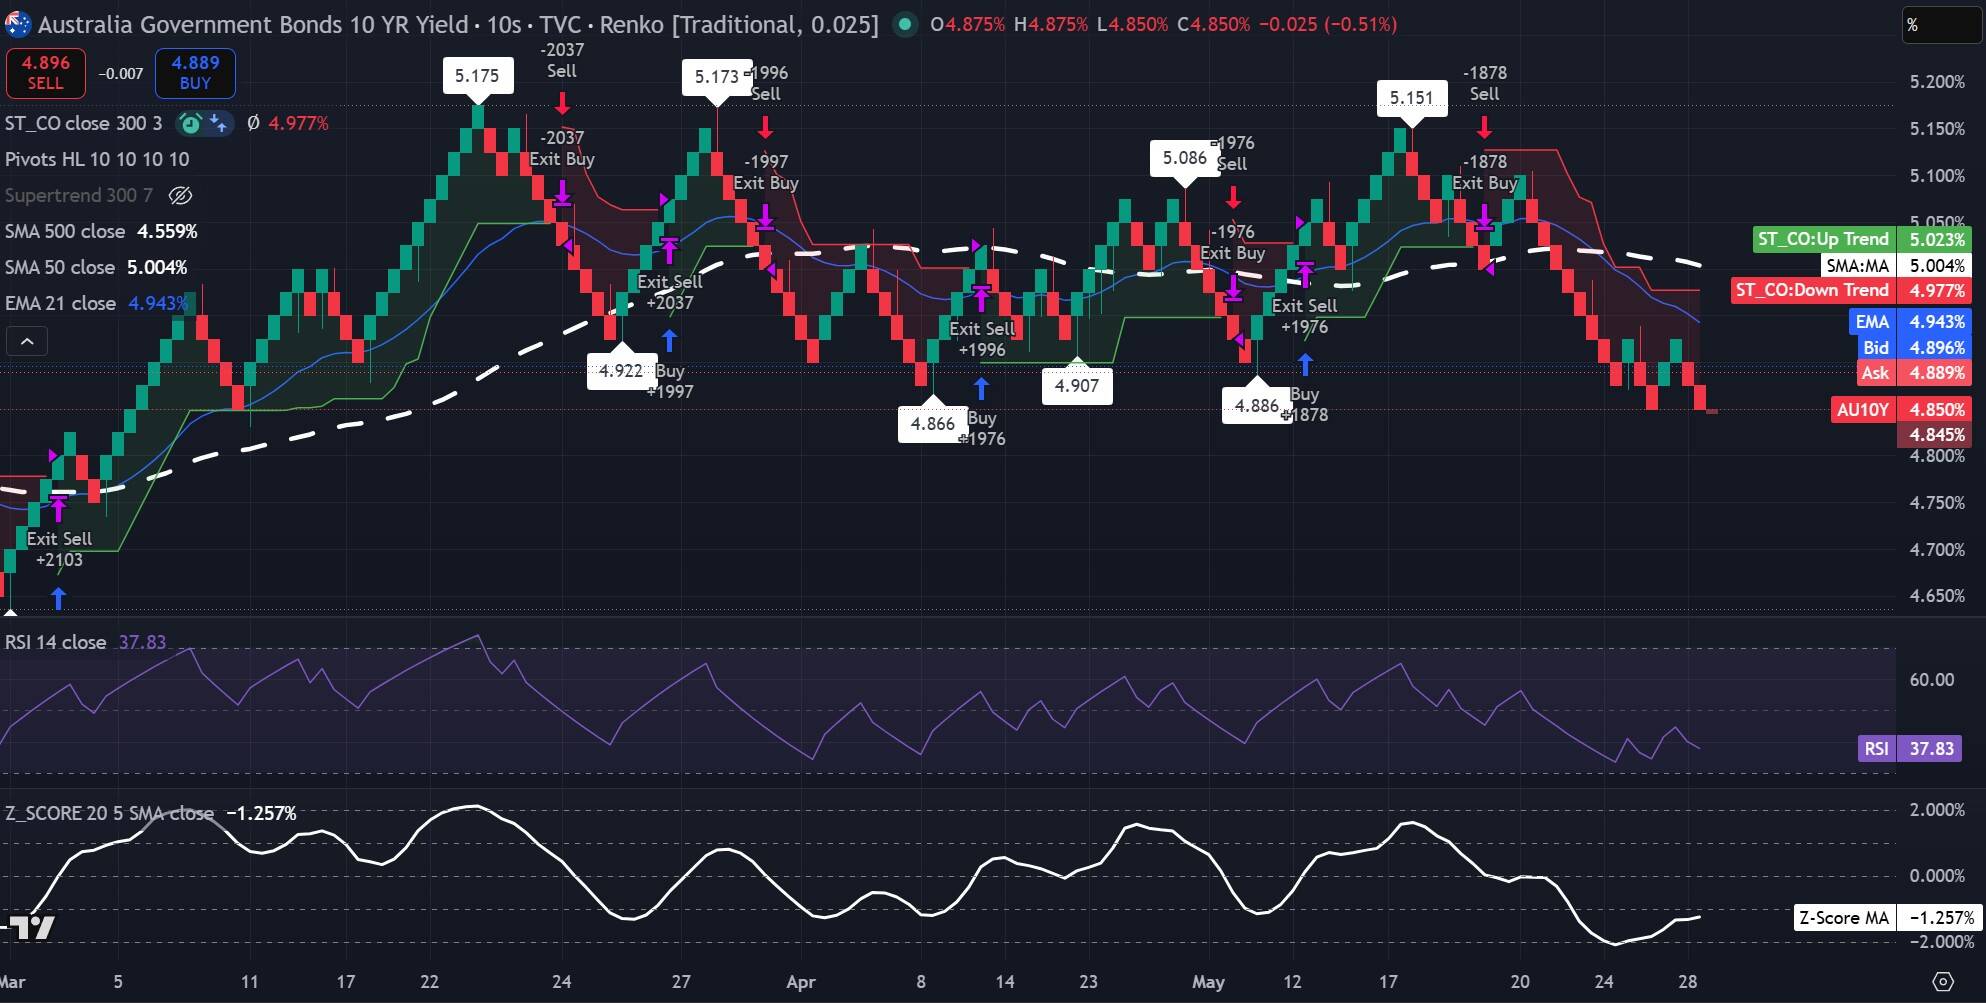
The Australian 10-year yield’s Renko bricks are sitting on 4.85% support., the bottom of the range that was set up since late March 2026. The Supertrend flipped red around the 19th May where the 10-year yield was trading around 5.0%. Subsequently, yields fell below the 21-EMA as well as the medium term trend following 50-SMA. The RSI is pointing lower and is around the 37 level but is also showing a bit of upward trend. Also, the Z-Score SMA is trending higher off the oversold levels. So yields may pick back up in the short term. We would need to see if the bricks can get back above the 50-SMA. If that occurs we may see another test of the top of the range near 5.175%.
ASX 200 Index Renko Reclaims The 500-SMA
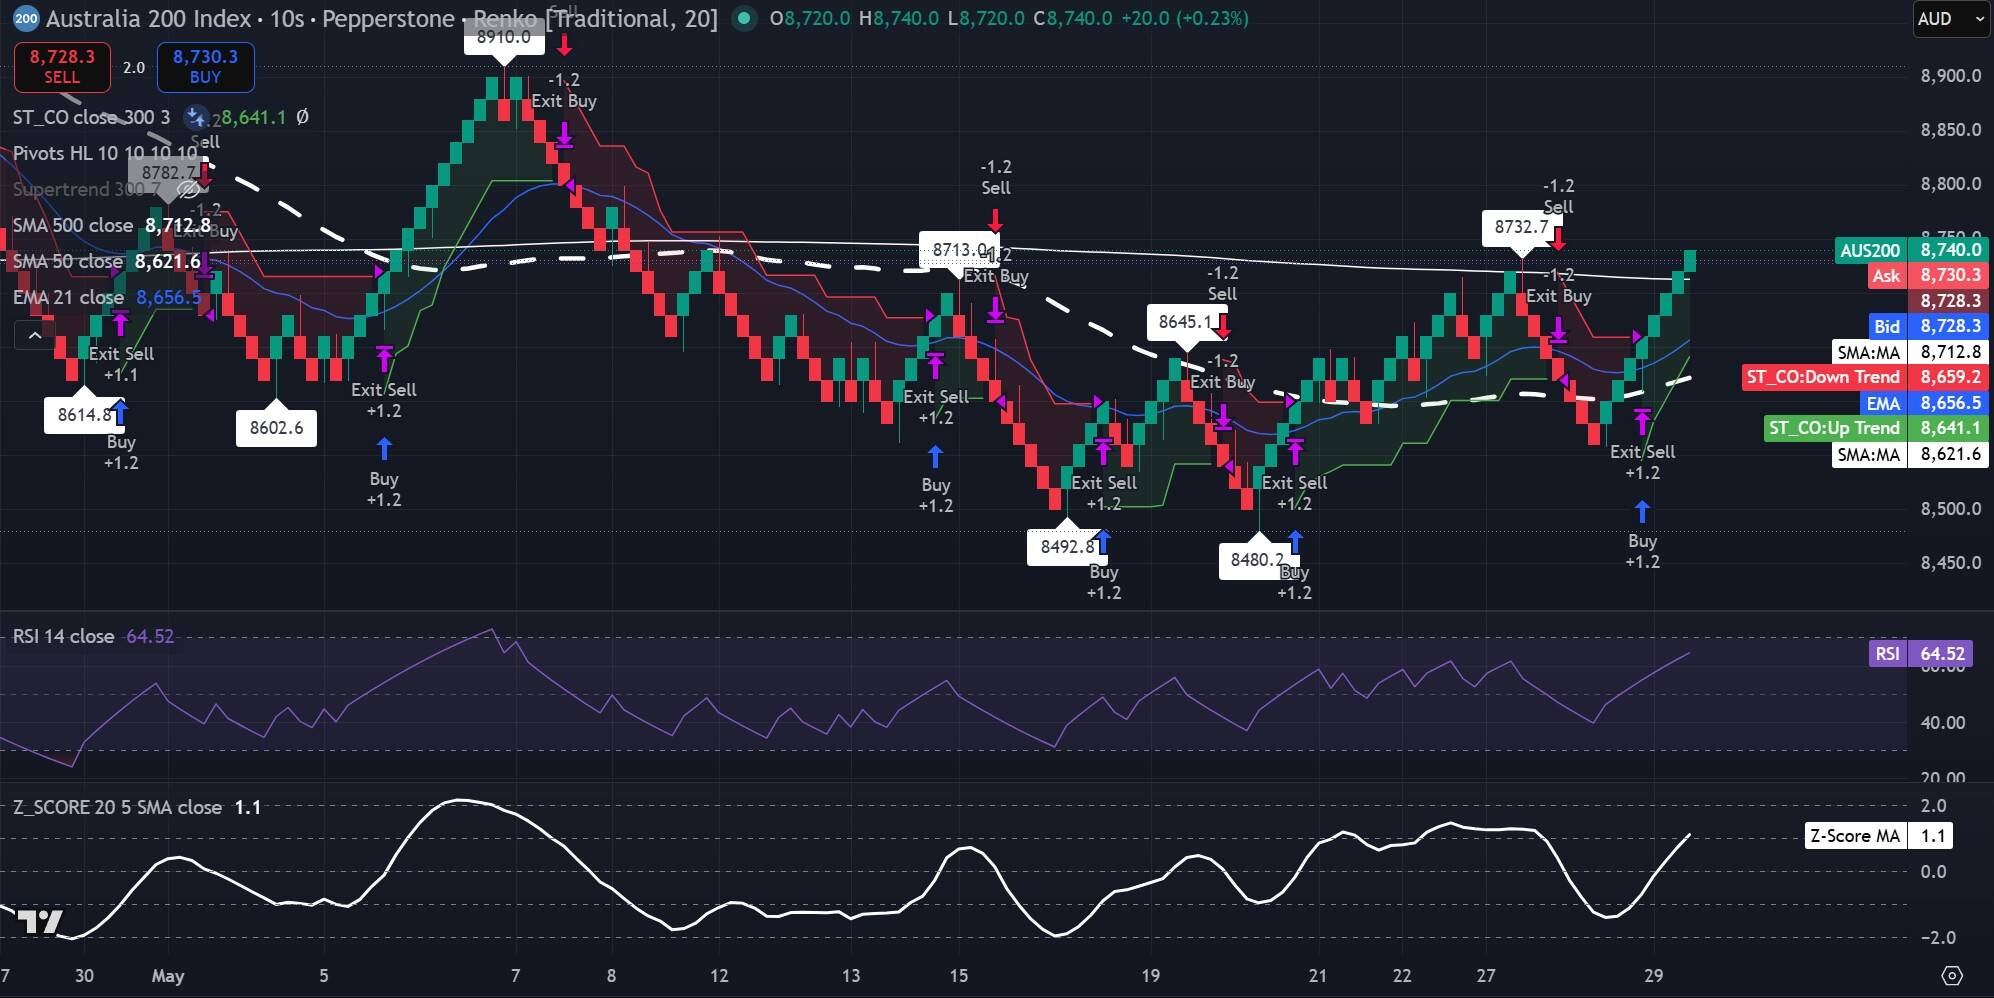
Finally. The ASX 200 Index is back above its long term trend following indicator on the Renko, the 500-SMA. It has been below this MA since early May 2026. From there it got some support around the 8480 to 8495 zone and made a 1st attempt at the 500-SMA and failed. From there a lower high was made around the 8,555 level where it finally got the momentum to push above the 21-EMA, 50-SMA, flip the Supertrend to positive and get back above the 500-SMA. My expectations are for some consolidation to occur around here as both the RSI and Z-Score SMA are looking extended but not exhausted. Bulls need a breather after putting in all that hard work in May.
ASX 200 Index Pushes Back Above the 500-SMA On 20-Brick Renko
Current Trend Direction: Bearish
Bias: Negative
Support Levels: 8,255
Resistance Levels: 8,800, 9,230
Medium Term Path: We’ve seen the ASX 200 Index get back above its 500-SMA. So things are starting to look positive for the Index. But to get things going in the medium term level, we now want to see a weekly close above the 8,800 level. This could be supported by declining yields and possibly firmer metals. Breaking 8,800 would definitely change my bias on the ASX 200 Index.


