Advertisement
Advertisement
AUD/USD Forex Technical Analysis – August 24, 2015 Forecast
By:
With China’s stock markets expected to open lower, traders are also calling for a lower opening by the AUD/USD. Fear surrounding the economic slowdown in
With China’s stock markets expected to open lower, traders are also calling for a lower opening by the AUD/USD. Fear surrounding the economic slowdown in the world’s second-biggest economy is driving the Australian Dollar lower since China is the country’s biggest customer.
The turmoil created by the recent action out of China is leading speculators to call for another interest rate hike by the Reserve Bank of Australia over the next 12 months. Over the past two weeks, China has created problems for Australia with the depreciation of the Chinese Yuan, the sell-off in equities, and a report showing that manufacturing activity had reached a 77-month low, increasing fears of a recession.
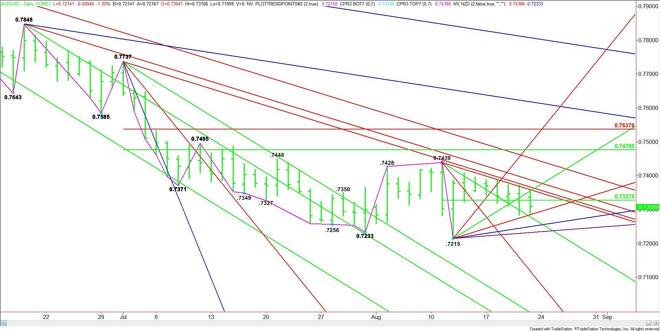
Technically, the main trend is down according to the daily swing chart. Last week, the Aussie ran into a cluster of resistance before selling off ahead of the week-end. The major downtrending resistance angles drop in at .7349, .7357 and .7378 today. Look for a bearish tone as long as the AUD/USD remains under these angles.
The short-term range is .7439 to .7215. The close under its pivot at .7327 is also creating a negative tone. This price is controlling the short-term direction of the market and should be watched closely.
The first downside target is an uptrending angle at .7255. The market could accelerate to the downside on a sustained move through this angle with the next target a price cluster at .7259 to .7255. Crossing to the weak side of these angles will likely lead to a test of the next angle at .7235. This is the last potential support angle before the .7215 main bottom.
A sustained move under .7215 will put the AUD/USD in an extremely weak position with the next target a downtrending angle at .7079.
Watch and read the price action at .7327 today. A sustained move under this level will be bearish. Overcoming this angle will indicate the presence of buyers.
About the Author
James Hyerczykauthor
James Hyerczyk is a U.S. based seasoned technical analyst and educator with over 40 years of experience in market analysis and trading, specializing in chart patterns and price movement. He is the author of two books on technical analysis and has a background in both futures and stock markets.
Advertisement
