


Bitcoin (BTC) has been relatively stalled in the past few days after failing to climb above the $80,000 mark on renewed macroeconomic woes and rising tensions in the Middle East.
During the weekend, the United States targeted and attacked three oil vessels owned by the Iranian regime as President Donald Trump’s administration continues to pressure the government to dismantle its nuclear program.
However, no progress has been made in the negotiations lately, and a prolonged conflict threatens to keep oil prices at high levels, which could result in high inflation for a longer period than expected.
Moreover, a stronger than expected jobs report published last week pushed the odds of a rate hike during the next FOMC meeting back to 58% after they briefly dipped at some point.
This is a headwind for risky assets like Bitcoin as it results in stricter financing conditions and lower liquidity across the markets.
Net Inflows to Bitcoin ETFs Hit $770 Million in Four Days
That said, net inflows to exchange-traded funds (ETFs) linked to Bitcoin continue to be strong in September, as $770 million have flowed to these vehicles during the first 4 business days of this month.

A simple run rate of that total for the remaining 18 business days of September gives us a projected total exceeding $4 billion. If this amount flows to Bitcoin ETFs, the price should continue its upward trajectory.
At this point, the crypto market has already priced in a rate hike for this month or the next. Hence, the impact of that headwind is limited. Meanwhile, if the White House’s pressure on the Fed results in a delay of that decision, that could further push prices to higher levels on easing conditions.
Sentiment remains strong based on the current state of the Crypto Fear and Greed Index. At 73, this gauge indicates that investors remain in “Greed” mode following positive news on the regulatory front in the United States.
Bitcoin Price Forecast
Every new Bitcoin analysis as it publishes, today's technical signal and key levels, live price — on one page.
See all Bitcoin forecastsBitcoin May Trade Below $80K Until a New Catalyst Helps It Break Its Bull Flag
Heading to the weekly chart, we continue to support a bullish outlook for Bitcoin with a long-term target exceeding $200,000 after a buy signal in the Relative Strength Index (RSI) was confirmed.
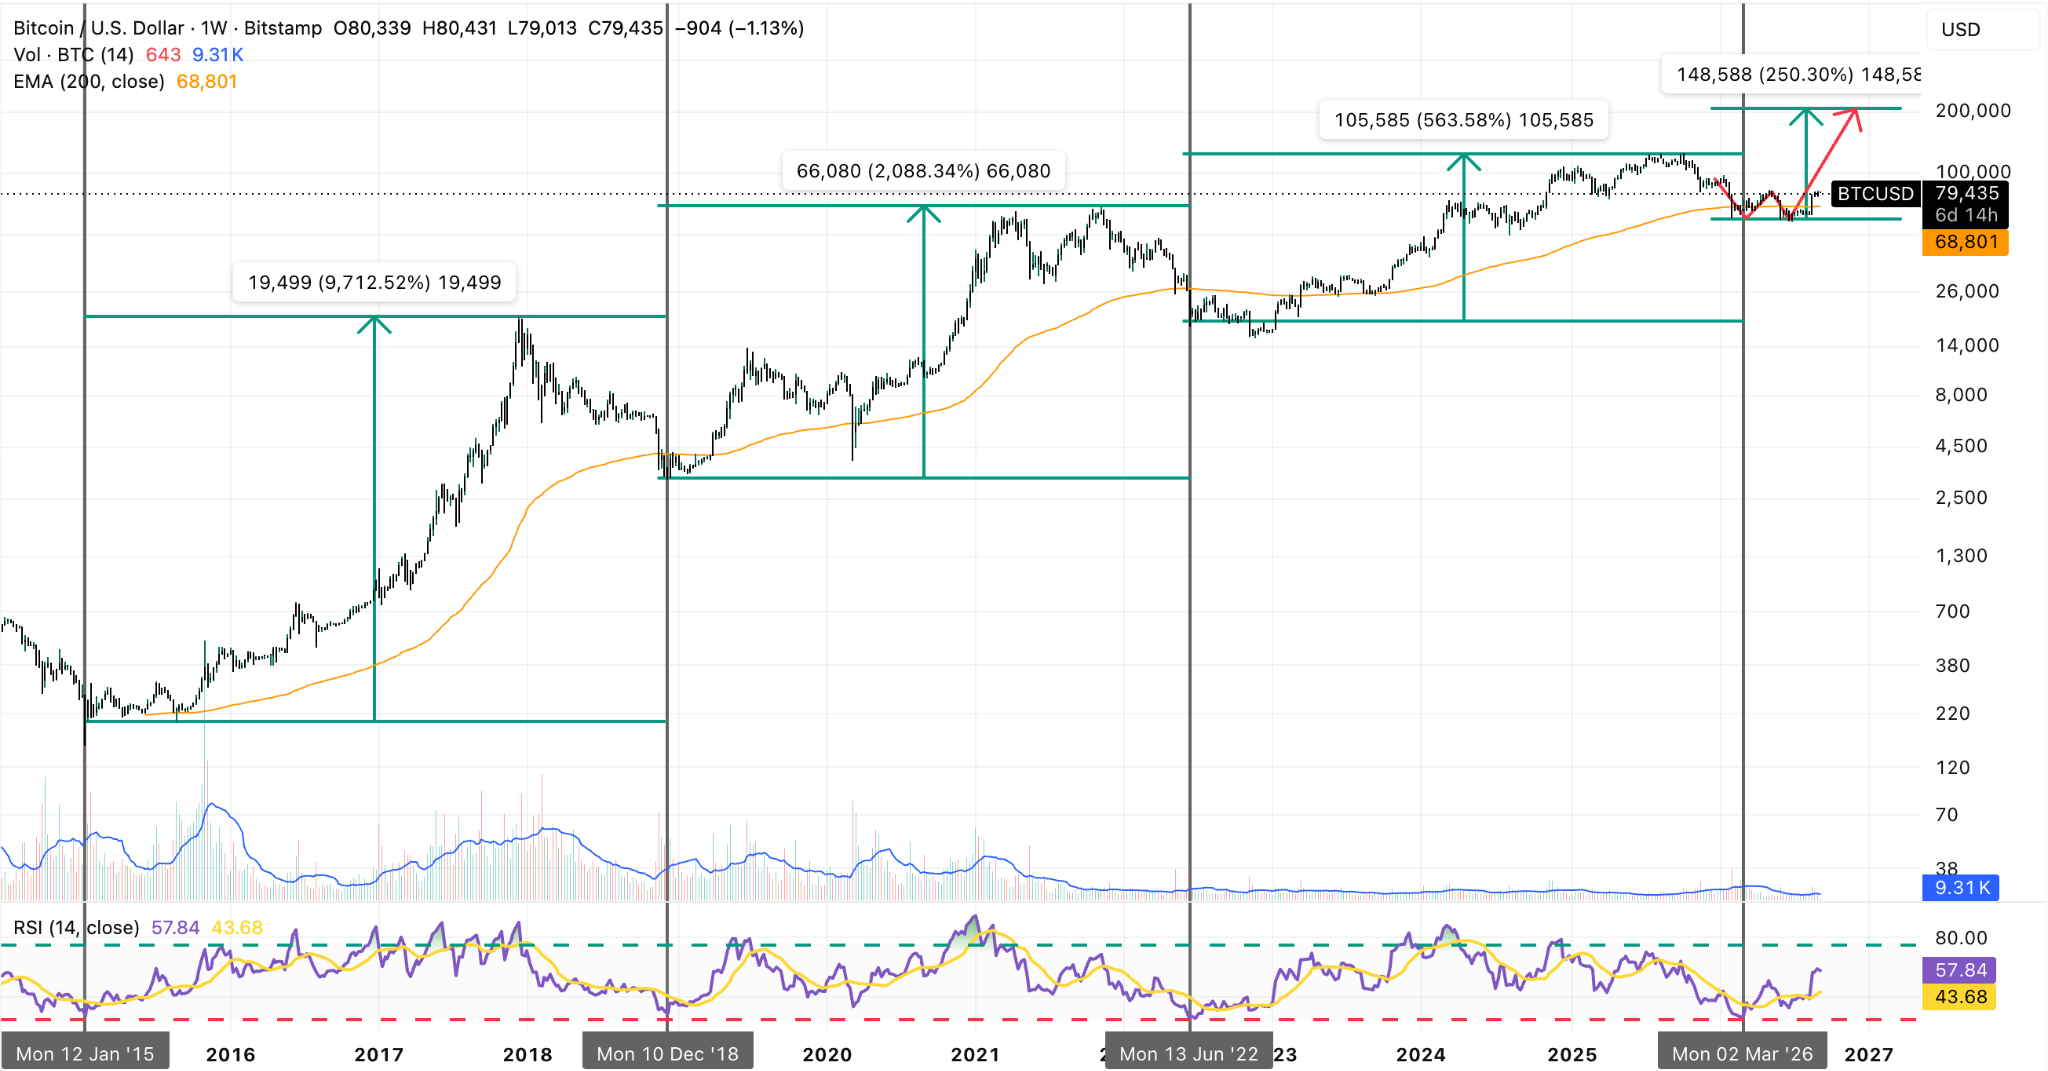
This signal has yielded impressive results in the past and pops up every time that momentum indicator hits 30. The last three times it has flashed, the price of BTC has made a new all-time high three to four years later.
Hence, we believe this recent bounce off $60K — our cycle bottom — and a break above the 200-day exponential moving average (EMA) could have marked the beginning of a new bullish cycle for the top crypto.
The $80,000 level is the key resistance to watch right now, as a W-shaped bullish pattern has formed in this weekly timeframe. A break above this price zone should confirm the beginning of the token’s next leg up, possibly eyeing the $100,000 threshold as the next stop.
Turning to the daily chart, a bull flag pattern is still the dominant setup in this time frame. If the price breaks past $80,000, we would anticipate the resumption of the current rally, making this a fractal of BTC’s higher time frames.
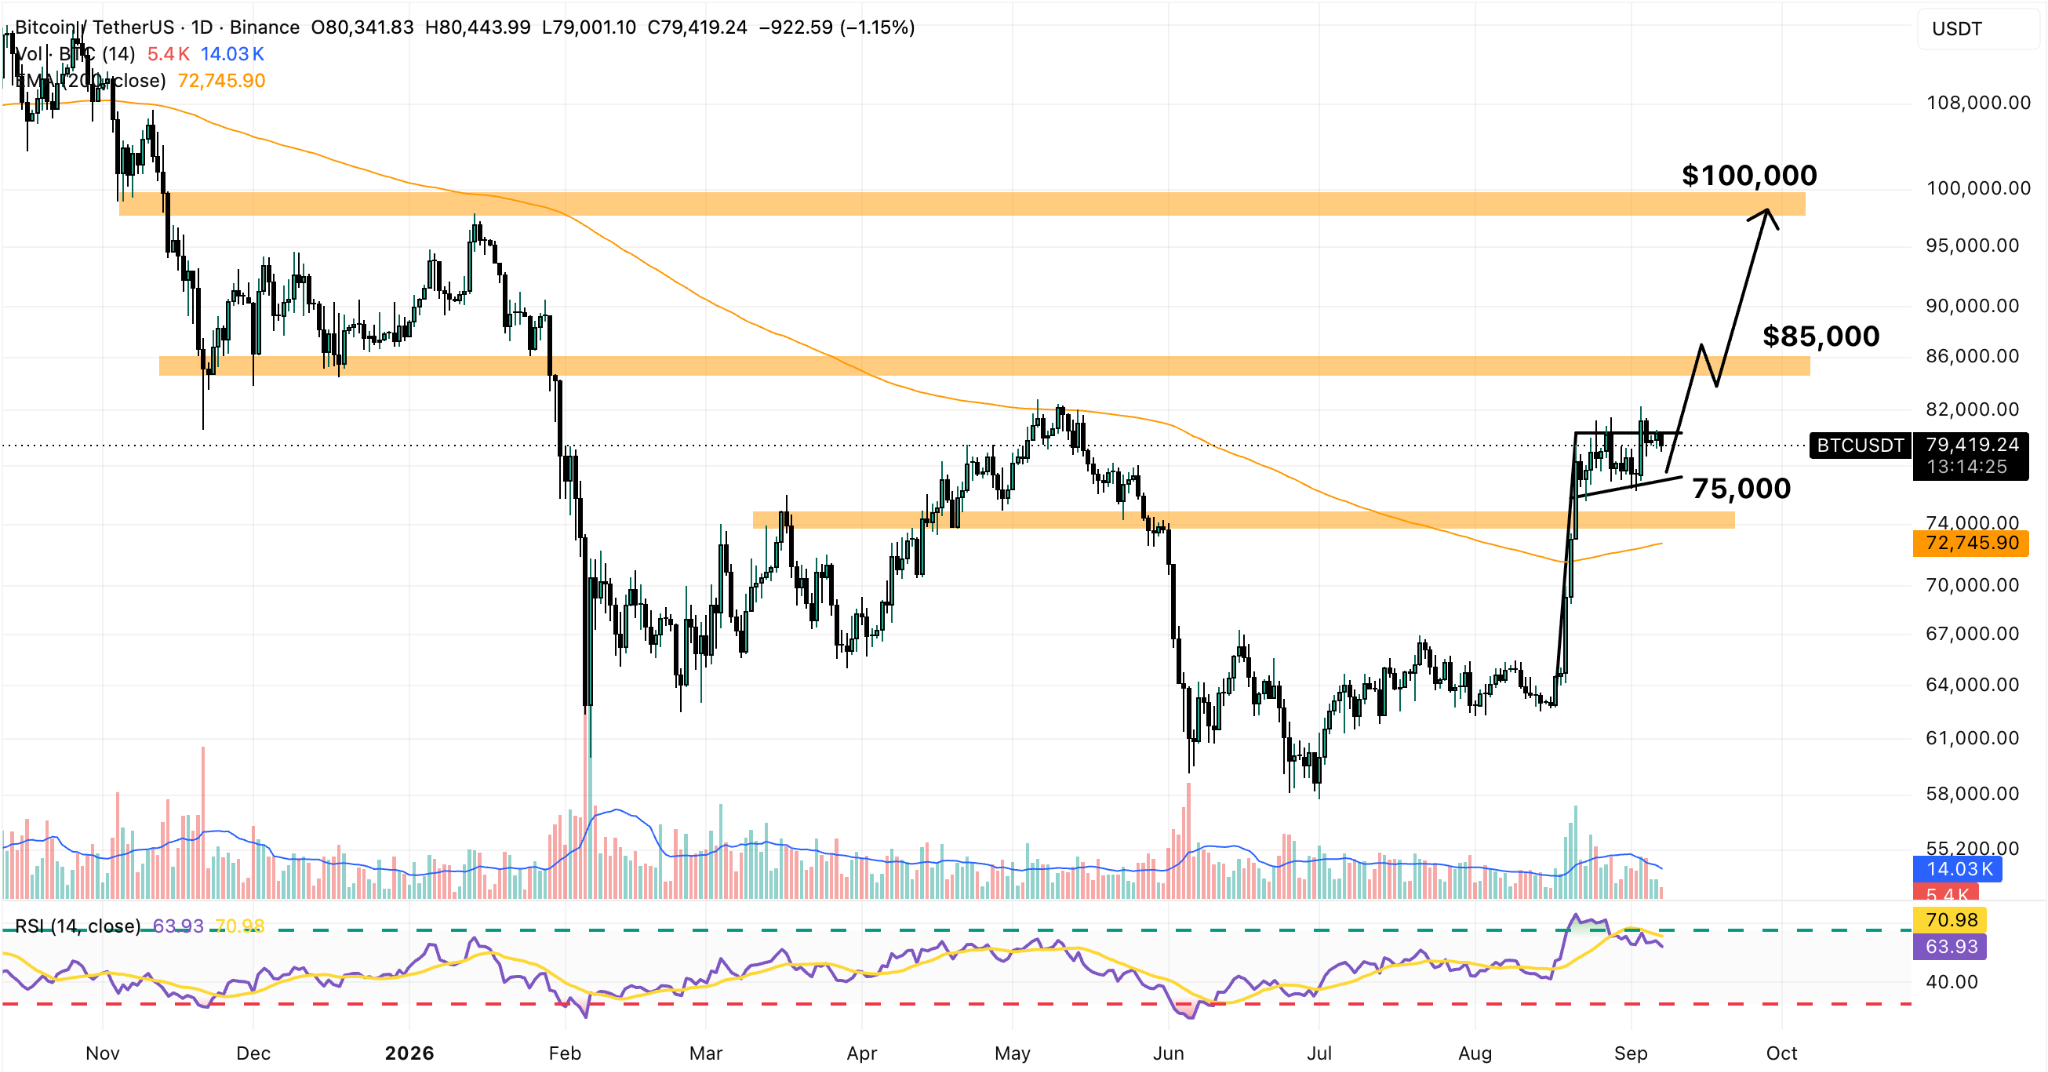
We still need a new driver to push past that resistance, as the SEC’s newly proposed crypto rules seem to have exhausted their firepower as a catalyst.