Cardano (ADA) could rebound toward $0.28 in the coming weeks as its price holds above a key weekly support level, potentially advancing a bullish reversal pattern that projects a much larger rally.

Cardano’s Inverse Head-and-Shoulders Setup Targets $0.60
ADA was trading near $0.234 on Oct. 13, after pulling back from its recent high near $0.28. However, the token remains above its 20-week exponential moving average (20-week EMA, green), suggesting buyers may still have an opportunity to regain control.
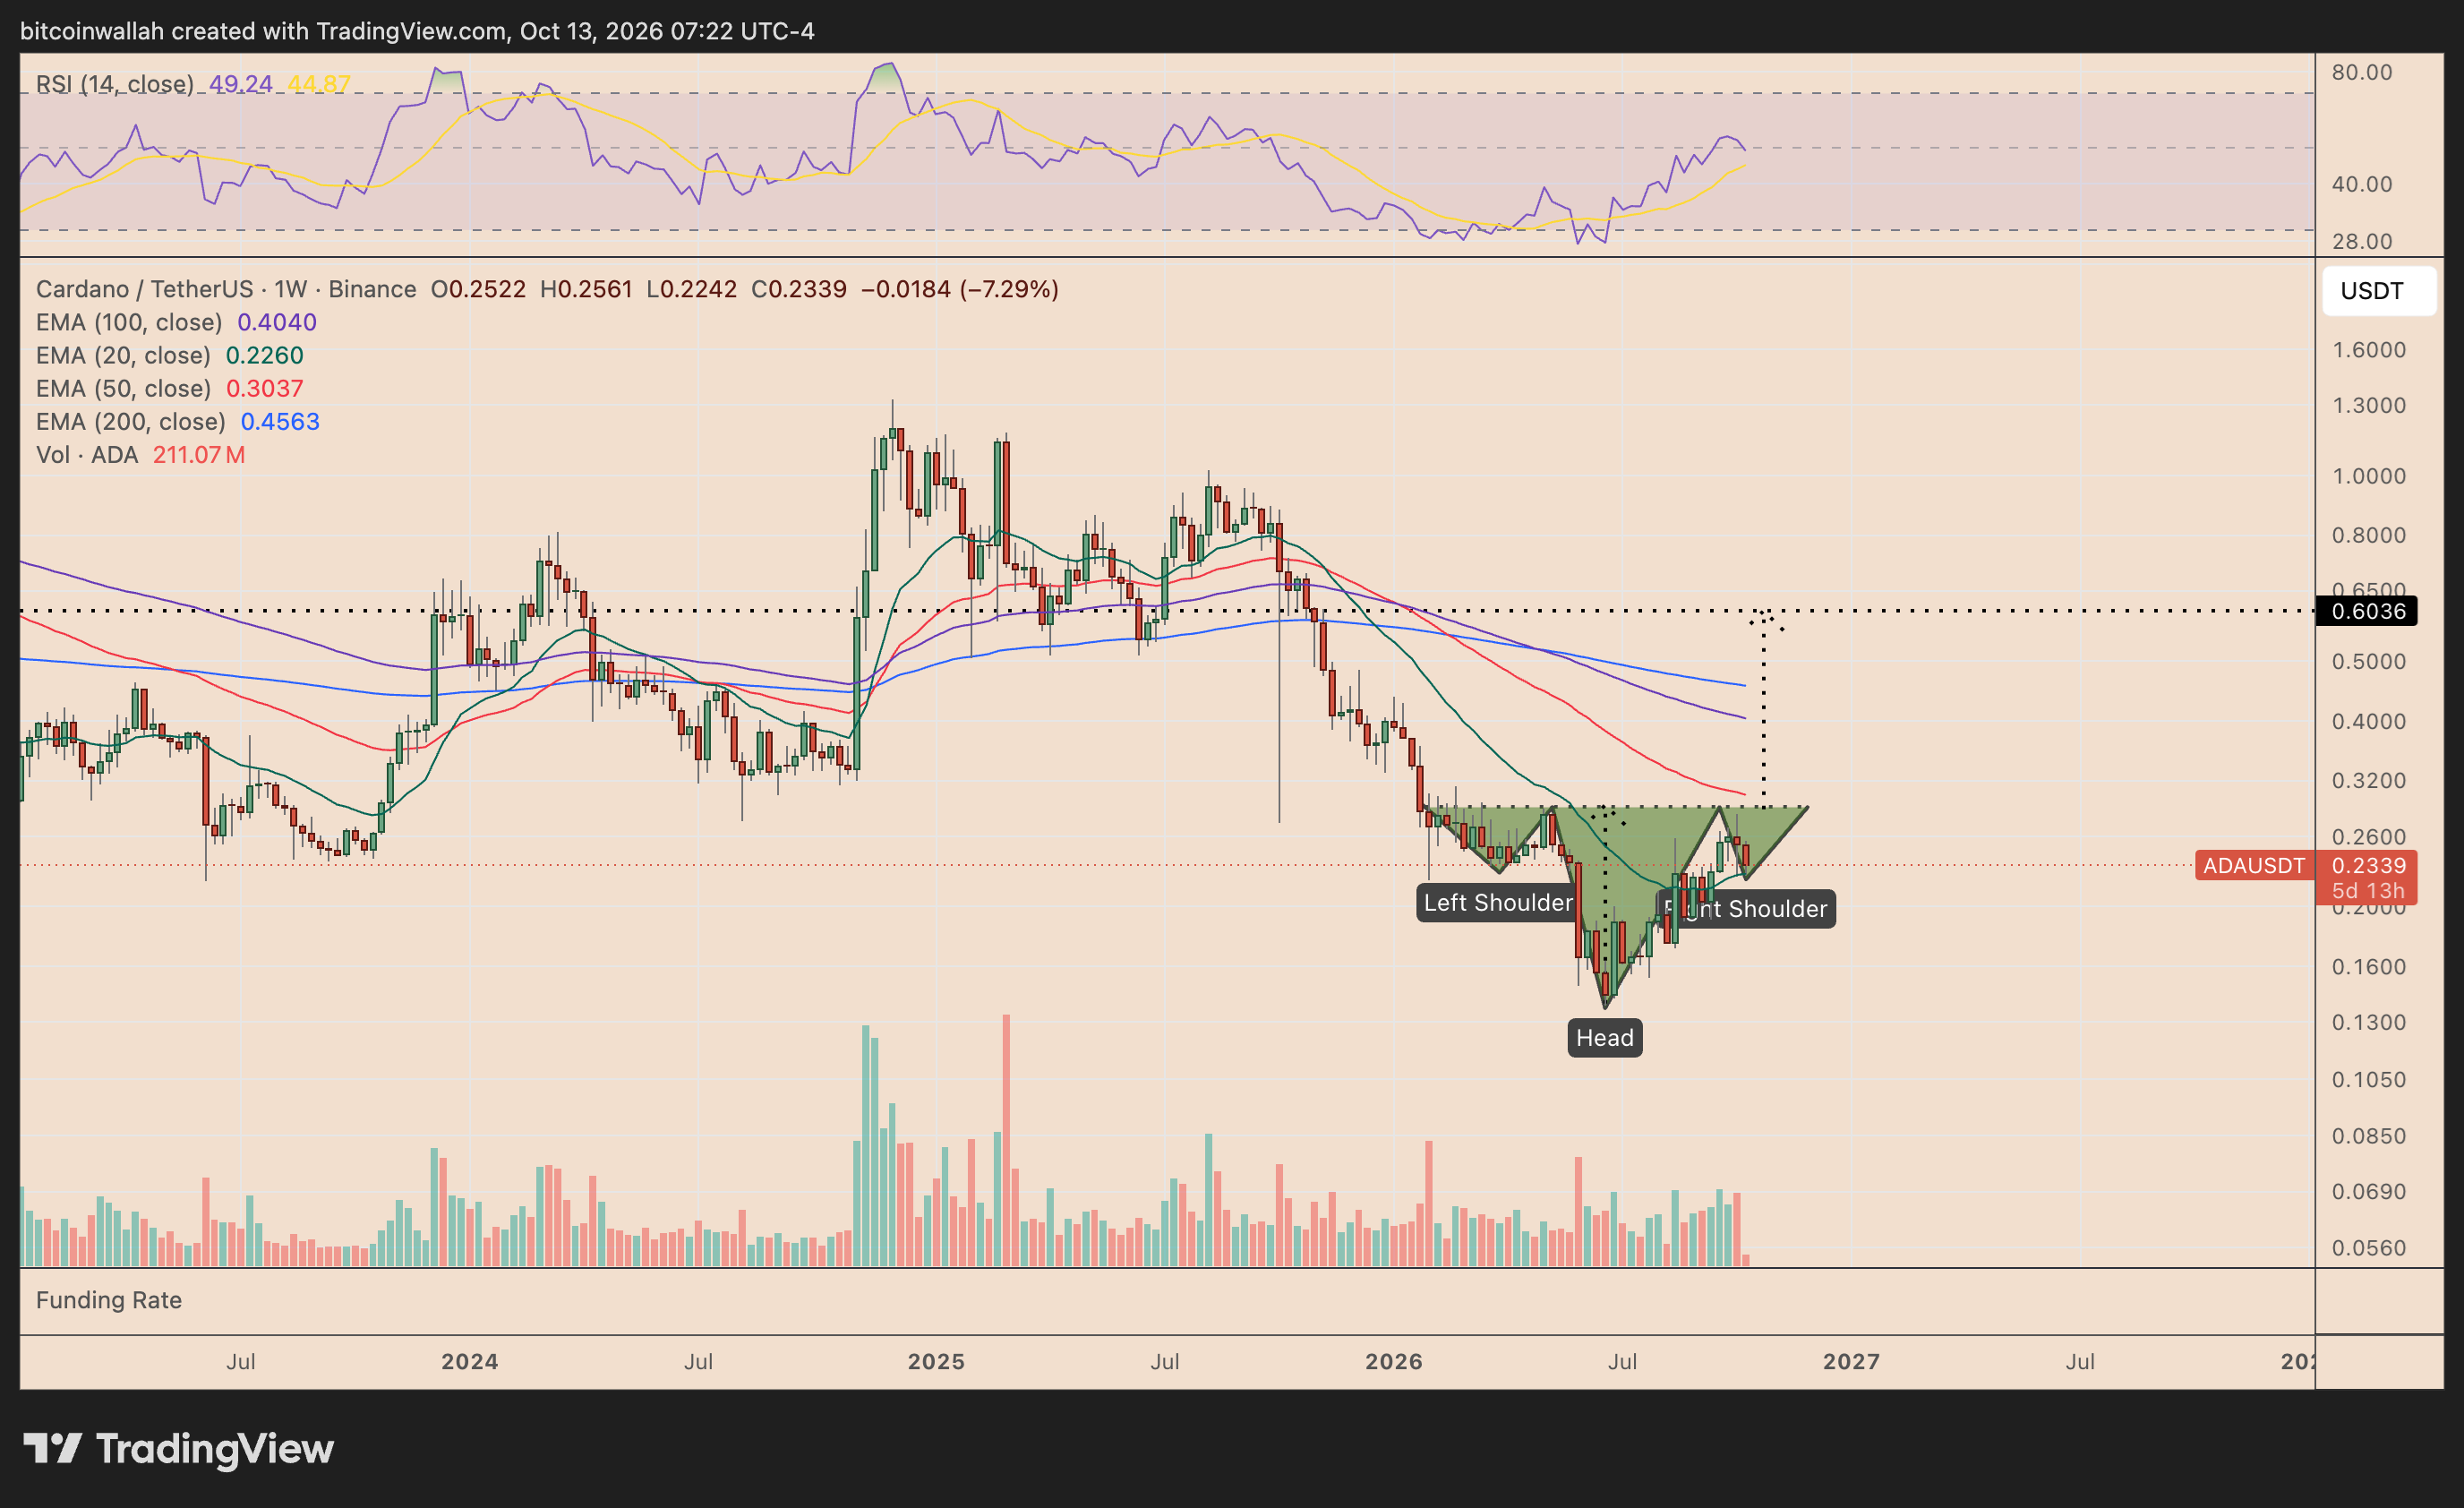
Cardano’s weekly chart shows a developing inverse head-and-shoulders pattern, a classic bullish reversal structure that typically forms after a prolonged downtrend.
The setup includes a left shoulder near $0.21-$0.22, a deeper head around $0.14-$0.15, and a potential right shoulder forming near current price levels.
Importantly, ADA is trading above its 20-week EMA near $0.226, which has emerged as immediate support following the latest correction.
A successful rebound from this moving average could push ADA toward the pattern’s neckline resistance around $0.28-$0.29, completing the right shoulder and bringing the bullish reversal setup closer to confirmation.
The weekly relative strength index (RSI) has also recovered toward 49 after previously approaching oversold territory, indicating that bearish momentum has weakened.
However, the inverse head-and-shoulders pattern will remain unconfirmed until ADA breaks decisively above its neckline.
Such a breakout could trigger a measured move toward $0.60, calculated by adding the approximate distance between the head and neckline to the breakout level. That represents roughly 155% upside from current prices.
The target also coincides with a historical resistance region near $0.60-$0.65, reinforcing its technical significance.
ADA Must First Clear $0.28-$0.30 Resistance
In my Oct. 5 Cardano forecast, I highlighted the $0.285-$0.30 region as a major resistance confluence involving the 100-period three-day EMA, an ascending-channel resistance line, and a broader distribution range.
ADA subsequently retreated from that region, but the emerging weekly reversal structure suggests another breakout attempt remains possible.
A decisive move above $0.30 would strengthen the broader bullish outlook, initially putting the $0.39-$0.40 region in focus before the larger inverse head-and-shoulders target near $0.60.
Conversely, a break below the 20-week EMA near $0.226 would weaken the immediate rebound case, exposing ADA to another decline toward $0.20 and potentially delaying the reversal setup.