Solana (SOL) faces a 55% drop toward $47–$48 as its latest recovery nears a major resistance zone, with a developing bear flag pattern signaling a potential continuation of the broader downtrend.

SOL Bear Flag Points to 55% Price Crash
SOL traded near $111.43 on Oct. 12, struggling to reclaim the $115–$125 region that previously acted as support.
The setup reinforces my Oct. 8 bearish forecast, which warned of another correction following SOL’s recovery toward overhead resistance.
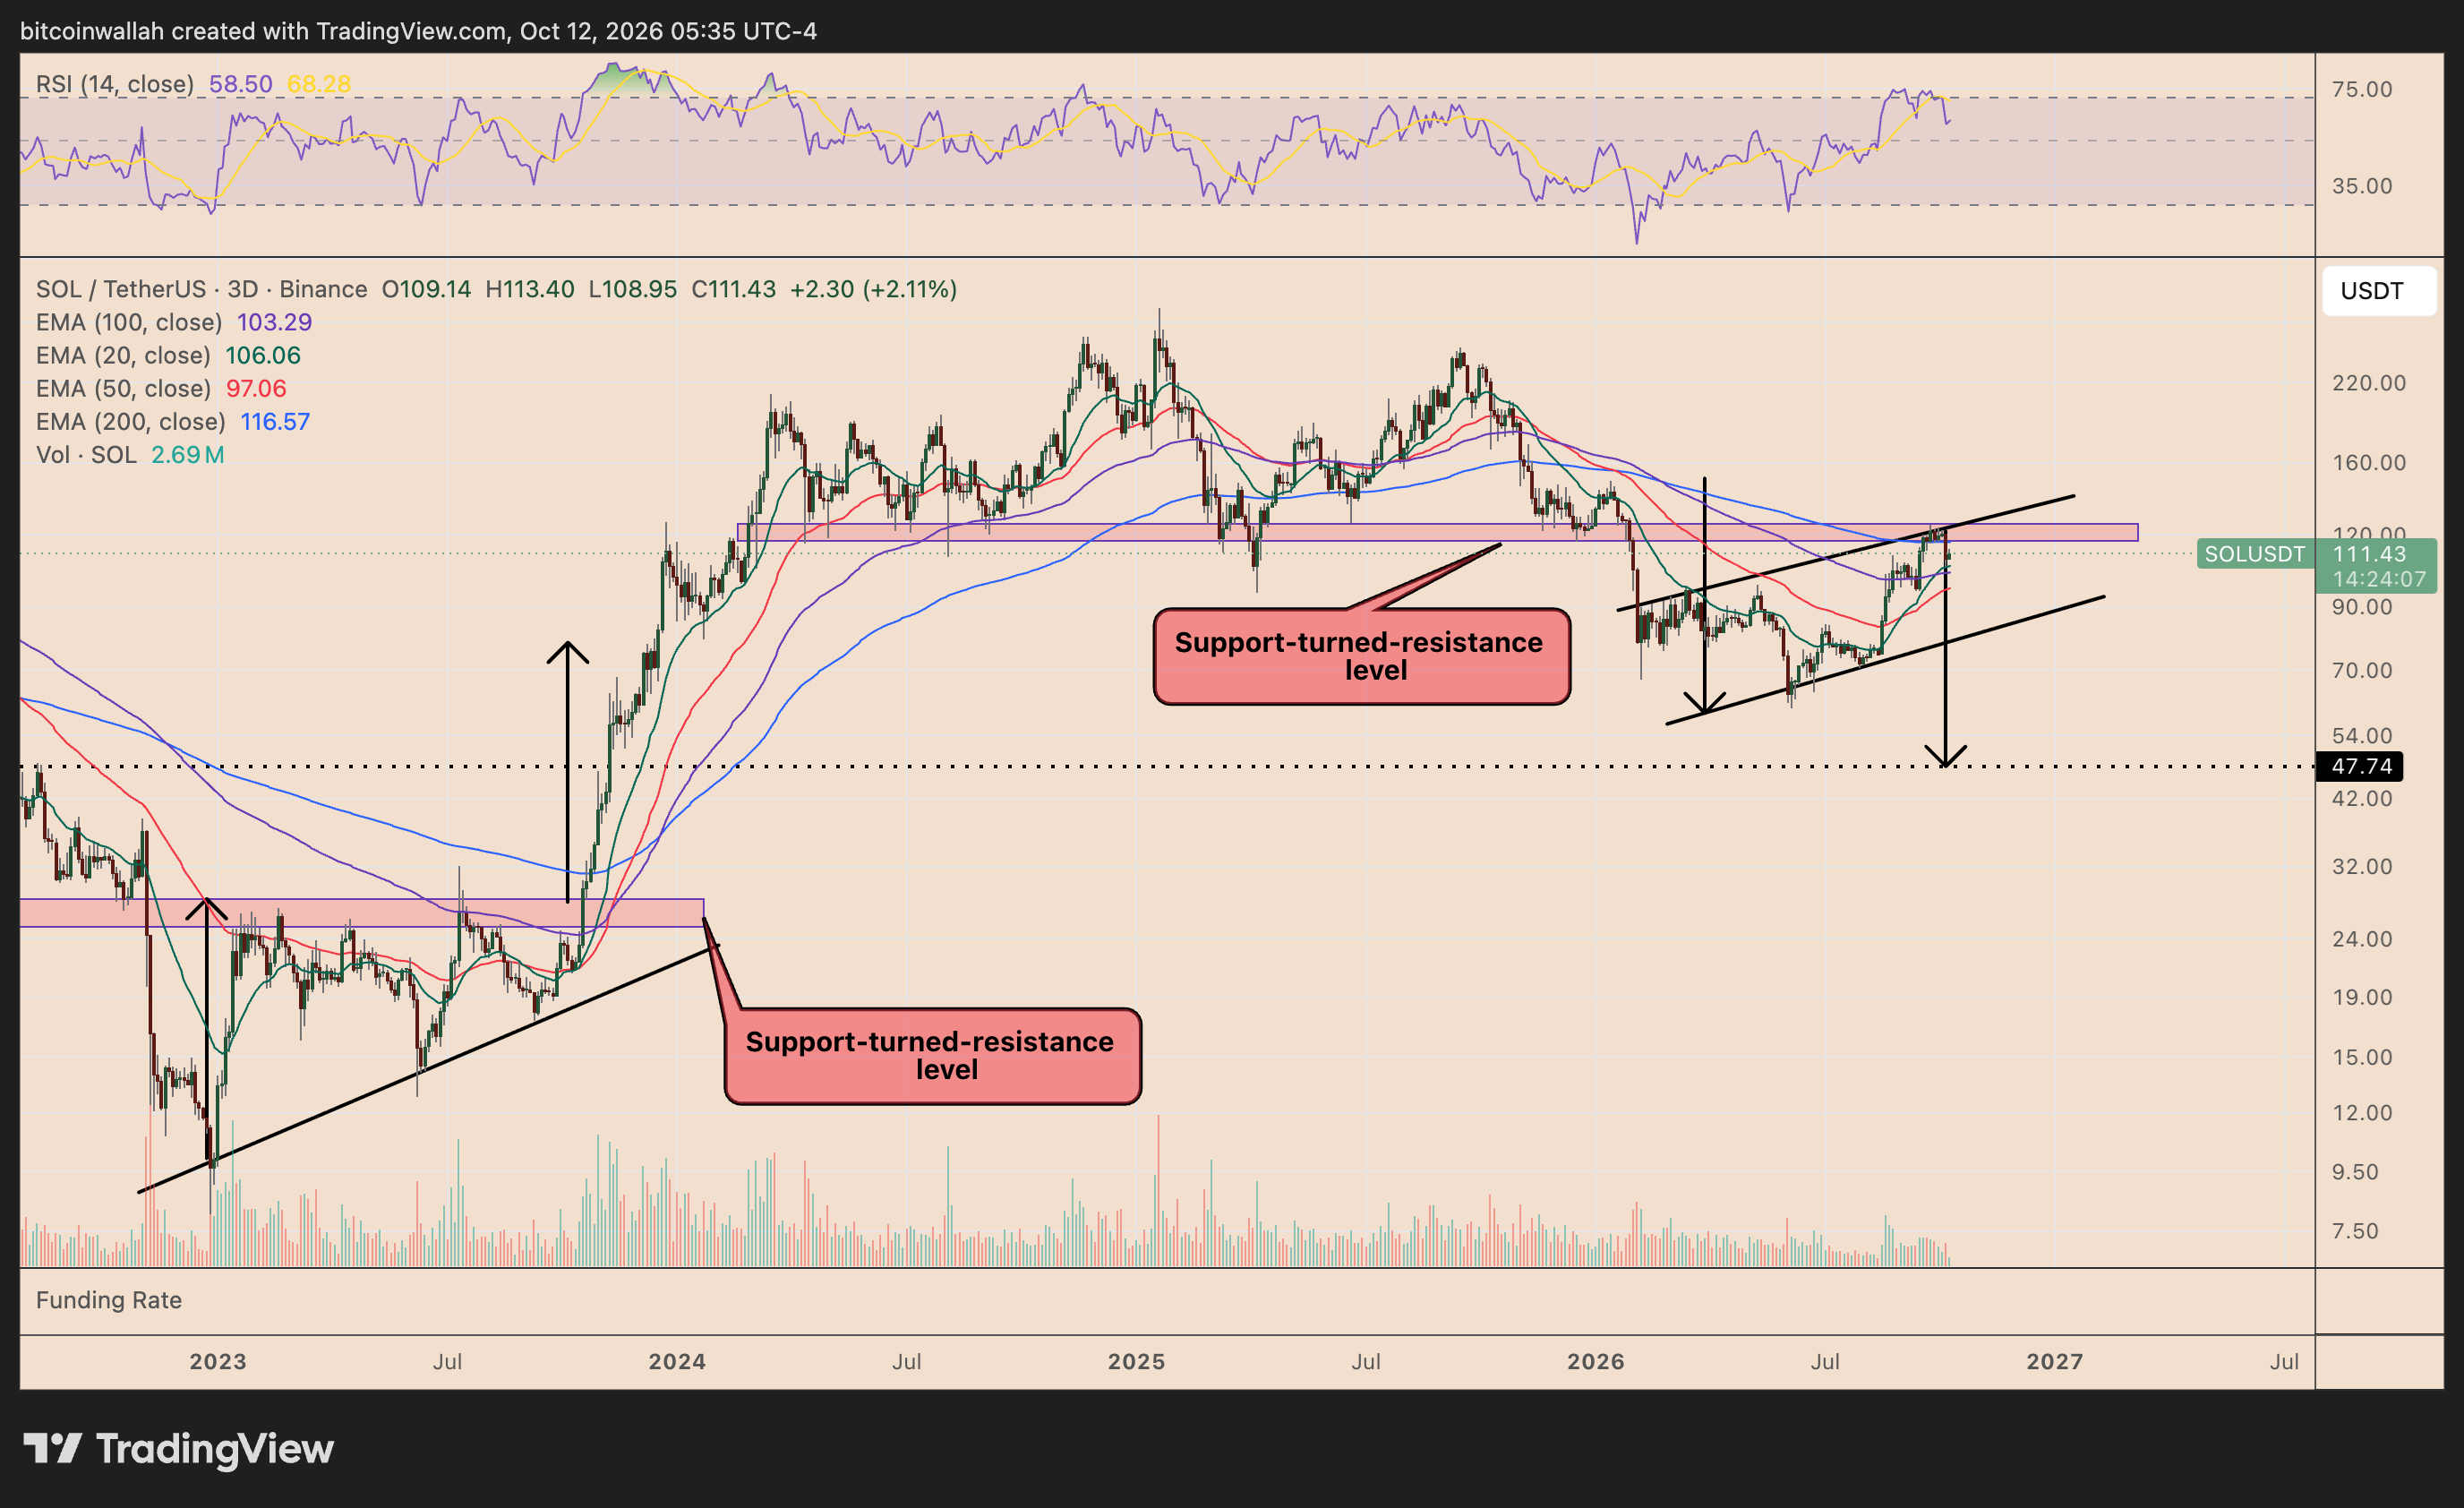
The initial selloff took SOL from approximately $150 toward $55. Its subsequent rebound has formed the flag portion of the structure, with prices now testing the channel’s upper trendline.
The resistance coincides with the $115–$125 supply zone, which supported SOL throughout much of 2025 before breaking down earlier this year.
Additionally, Solana’s 200-period exponential moving average on the three-day chart (200-3D EMA, blue), near $116.57, reinforces the resistance confluence.
Meanwhile, the three-day relative strength index (RSI) has retreated toward 58.50, suggesting weakening upside momentum.
A rejection could initially push SOL toward the flag’s lower trendline around $85–$90. A decisive breakdown below this support would confirm the bearish continuation pattern.
Applying the flagpole’s height to the projected breakdown point yields a downside target near $47.74, roughly 55% below current prices.
The outlook resembles Solana’s 2022 structure, when a breakdown below the $25–$27 support zone was followed by an unsuccessful retest and a deeper selloff toward $8.
However, a sustained three-day close above $125 would weaken the bearish setup and challenge the projected decline.
Solana Price Forecast
Every new Solana analysis as it publishes, today's technical signal and key levels, live price — on one page.
See all Solana forecastsFed Uncertainty and Oil Prices Add to SOL’s Downside Risks
Solana’s bearish setup is developing against an uncertain macroeconomic backdrop, with elevated oil prices, rising Treasury yields, and persistent inflation concerns threatening demand for risk assets.
Brent crude remained above $100 per barrel on Oct. 12, as Middle East tensions continued to threaten energy supplies. Meanwhile, the US 10-year Treasury yield hovered near 5.25%, tightening financial conditions and potentially reducing investors’ appetite for speculative assets such as SOL.
Markets currently assign roughly an 18% probability of a Federal Reserve rate hike in October, suggesting policymakers may pause after September’s tightening. However, expectations could shift following upcoming US inflation data.
A hotter-than-expected inflation reading could revive rate hike bets, strengthen the dollar, and pressure cryptocurrencies further.
Conversely, cooling inflation and declining oil prices could improve risk sentiment, potentially helping SOL reclaim the $115–$125 resistance zone and weaken its bearish technical outlook.