Bitcoin (BTC) is approaching a rare golden cross on its three-day chart, a bullish technical signal associated with an average 33.78% price rally across three historical examples.
The crossover could form as early as this week, potentially strengthening Bitcoin’s broader recovery outlook as improving macroeconomic and on-chain conditions raise hopes of an October bottom.

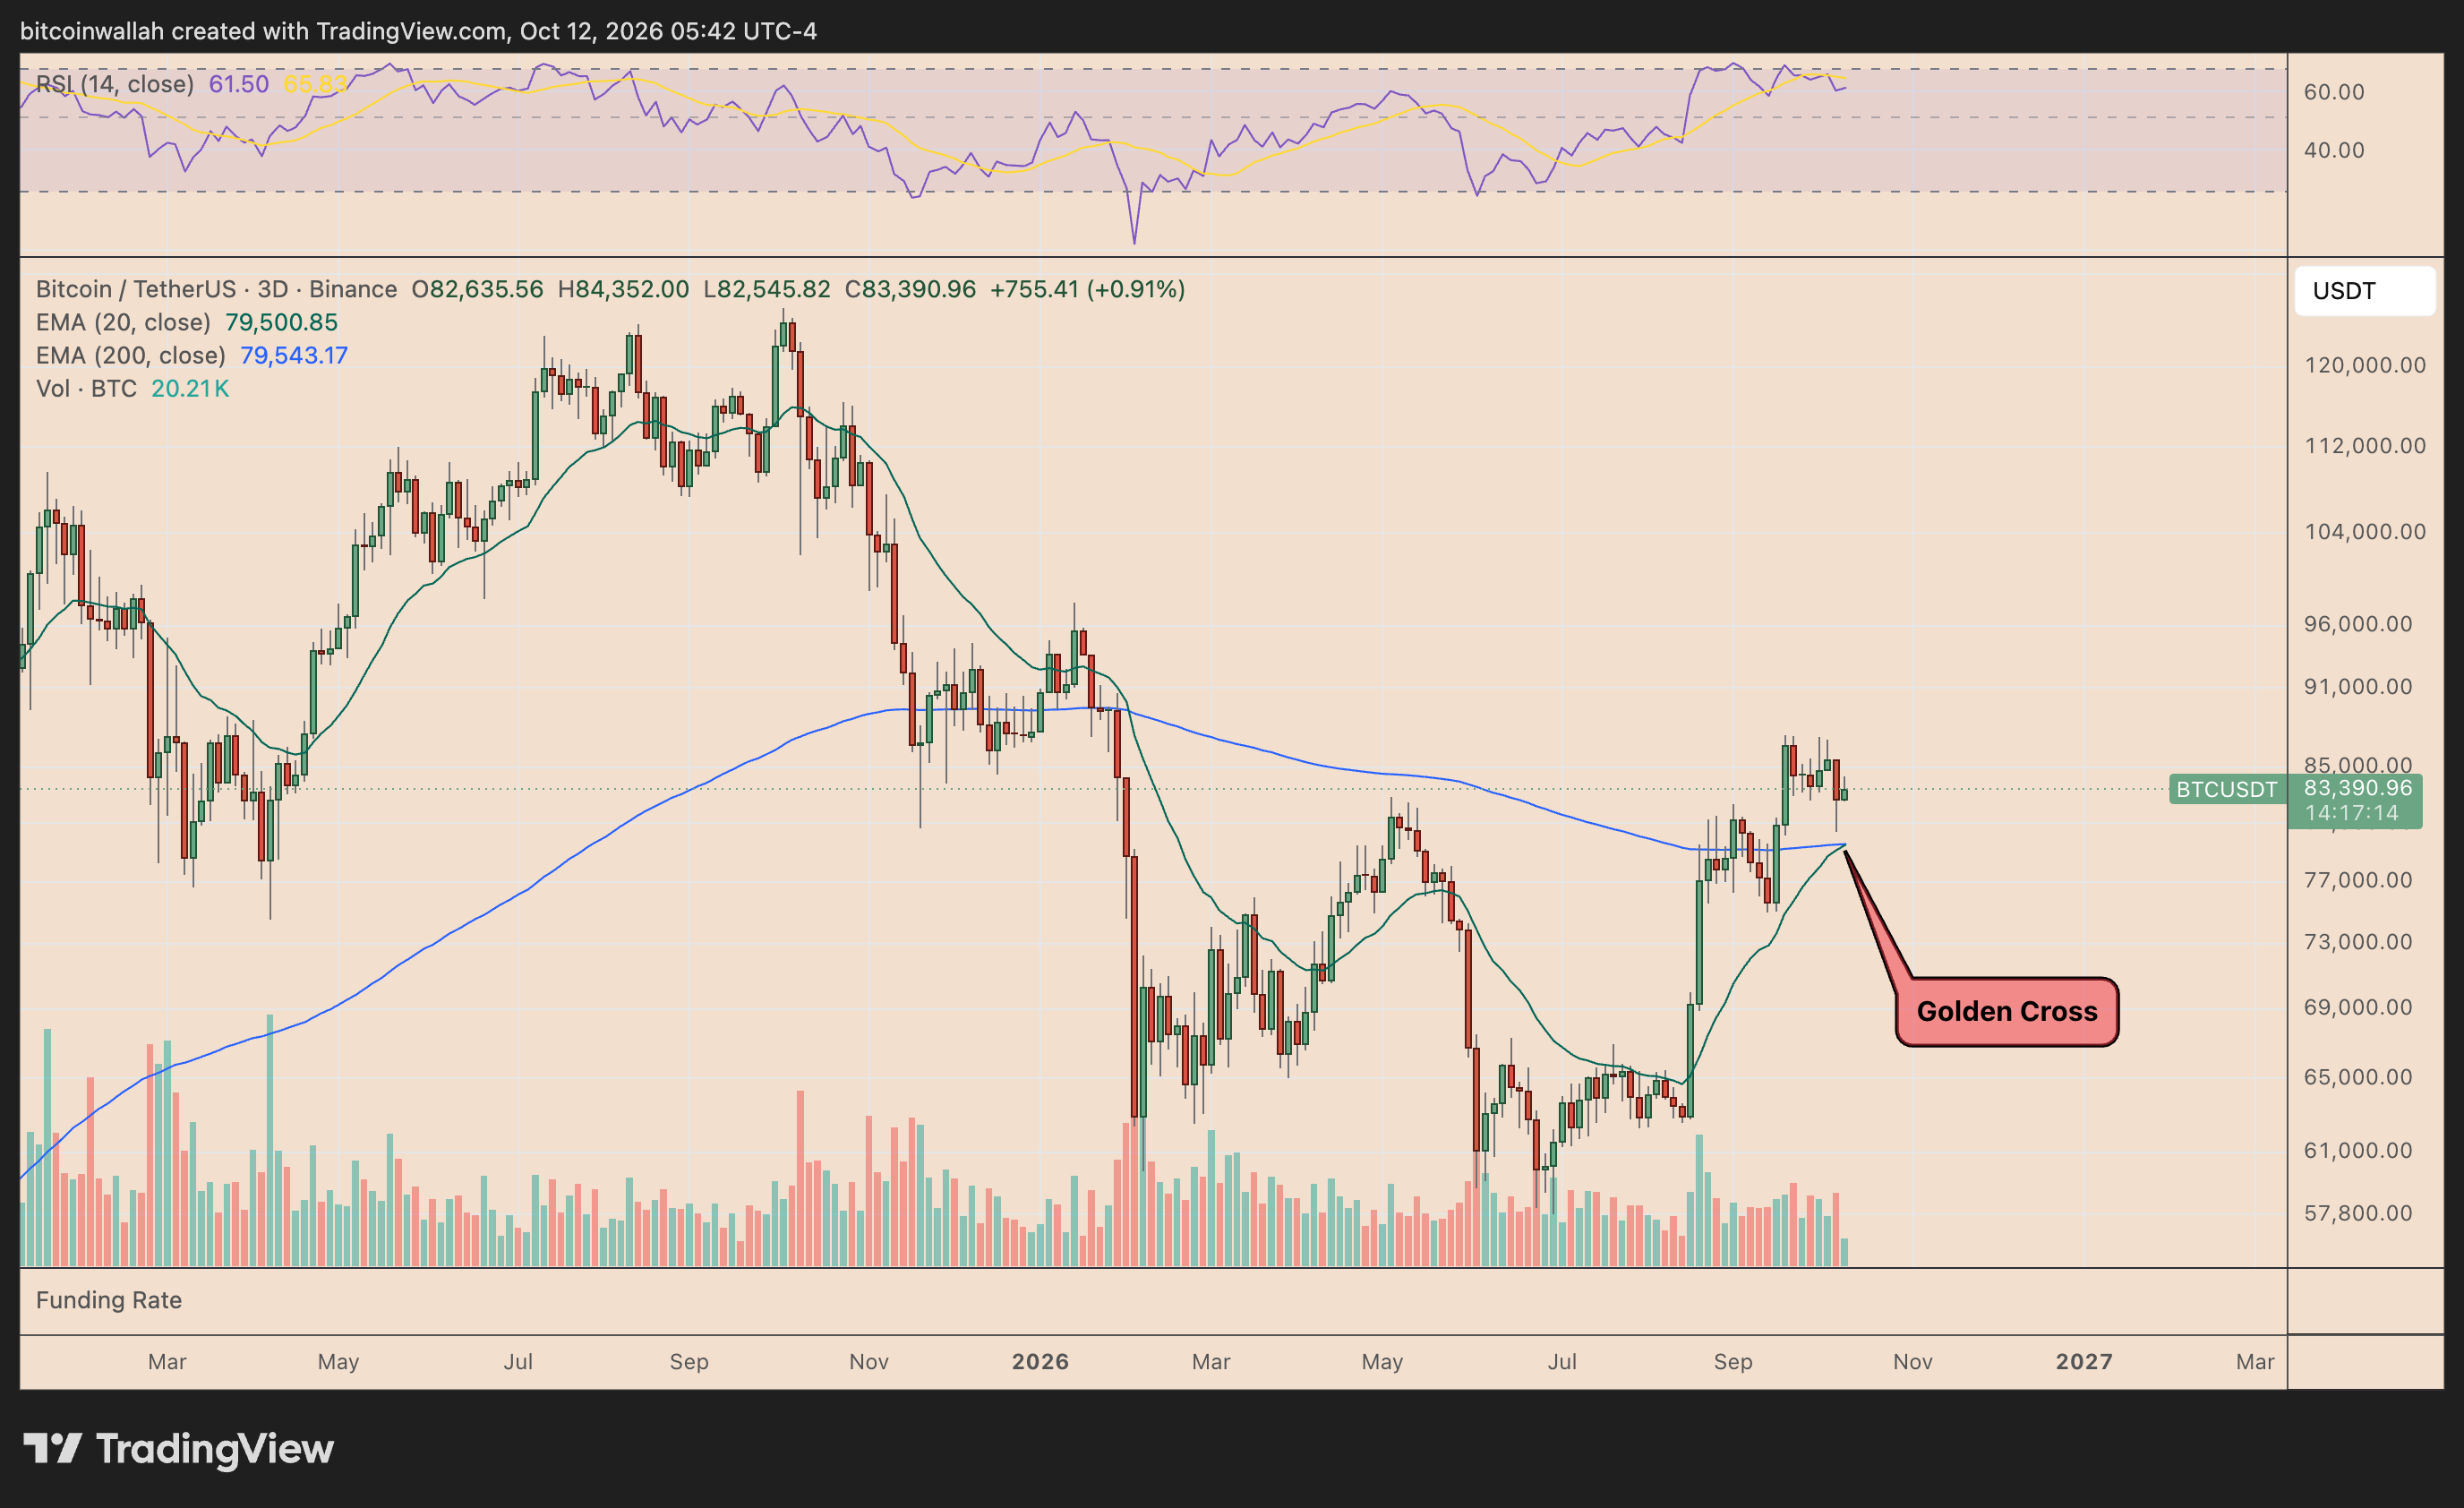
The formation, commonly known as a golden cross, occurs when a shorter-term moving average rises above a longer-term one, signaling improving momentum and potentially the beginning of a sustained bullish trend.
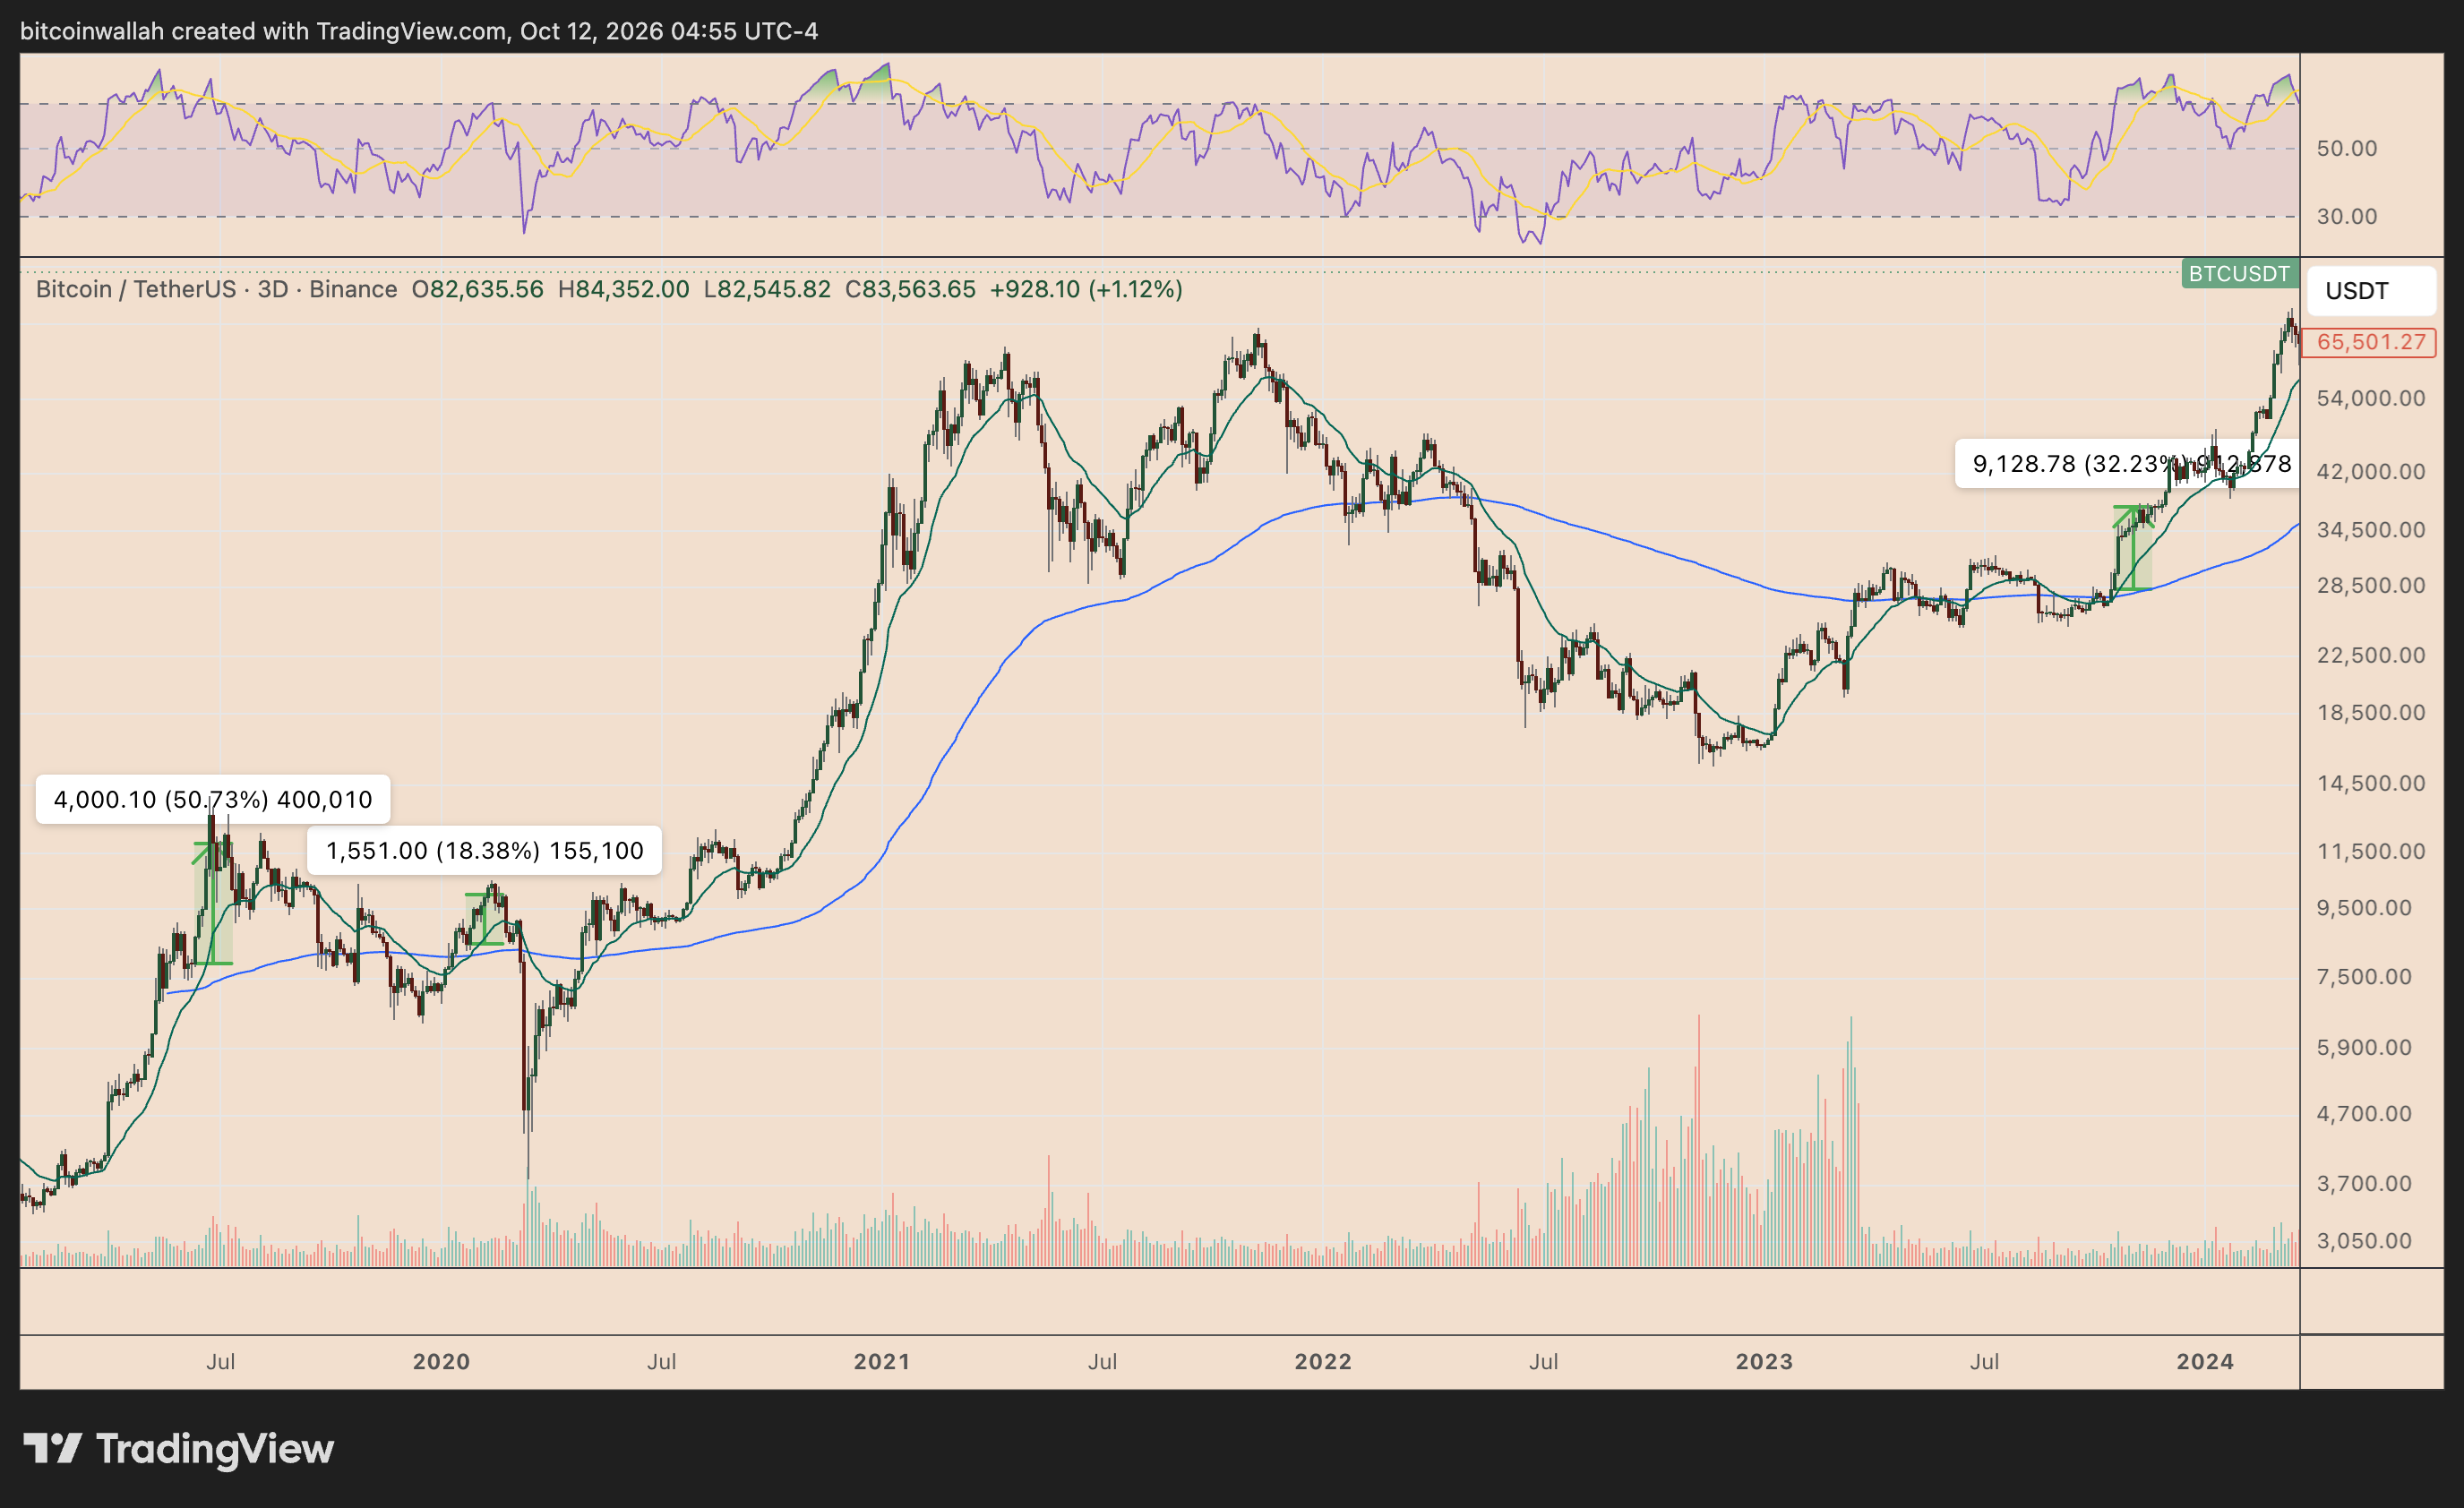
In 2019, Bitcoin rallied approximately 50.73% following a similar bullish moving-average configuration. The 2020 occurrence was associated with an 18.38% advance, while another instance in 2023–2024 saw BTC climb roughly 32.23%.
These three rallies produced an average gain of 33.78%, underscoring the pattern’s historical bullish implications.
However, the gains unfolded over different timeframes, meaning the average should not be interpreted as a 30-day return or a guaranteed price target.
The latest formation comes as Bitcoin trades near $83,500, following its recovery from September’s consolidation phase.
A confirmed golden cross could strengthen the bullish outlook, particularly if BTC continues establishing higher highs and higher lows.
Still, golden crosses are lagging indicators. Bitcoin could experience short-term pullbacks even after confirmation, while a sustained decline below the longer-term moving average would weaken the bullish thesis.
Bitcoin Price Forecast
Every new Bitcoin analysis as it publishes, today's technical signal and key levels, live price — on one page.
See all Bitcoin forecastsBitcoin Bottom Signals Strengthen Ahead of US Midterm Elections
Bitcoin’s potential golden cross coincides with signs that its October correction may be approaching exhaustion, according to an analysis by xWIN.
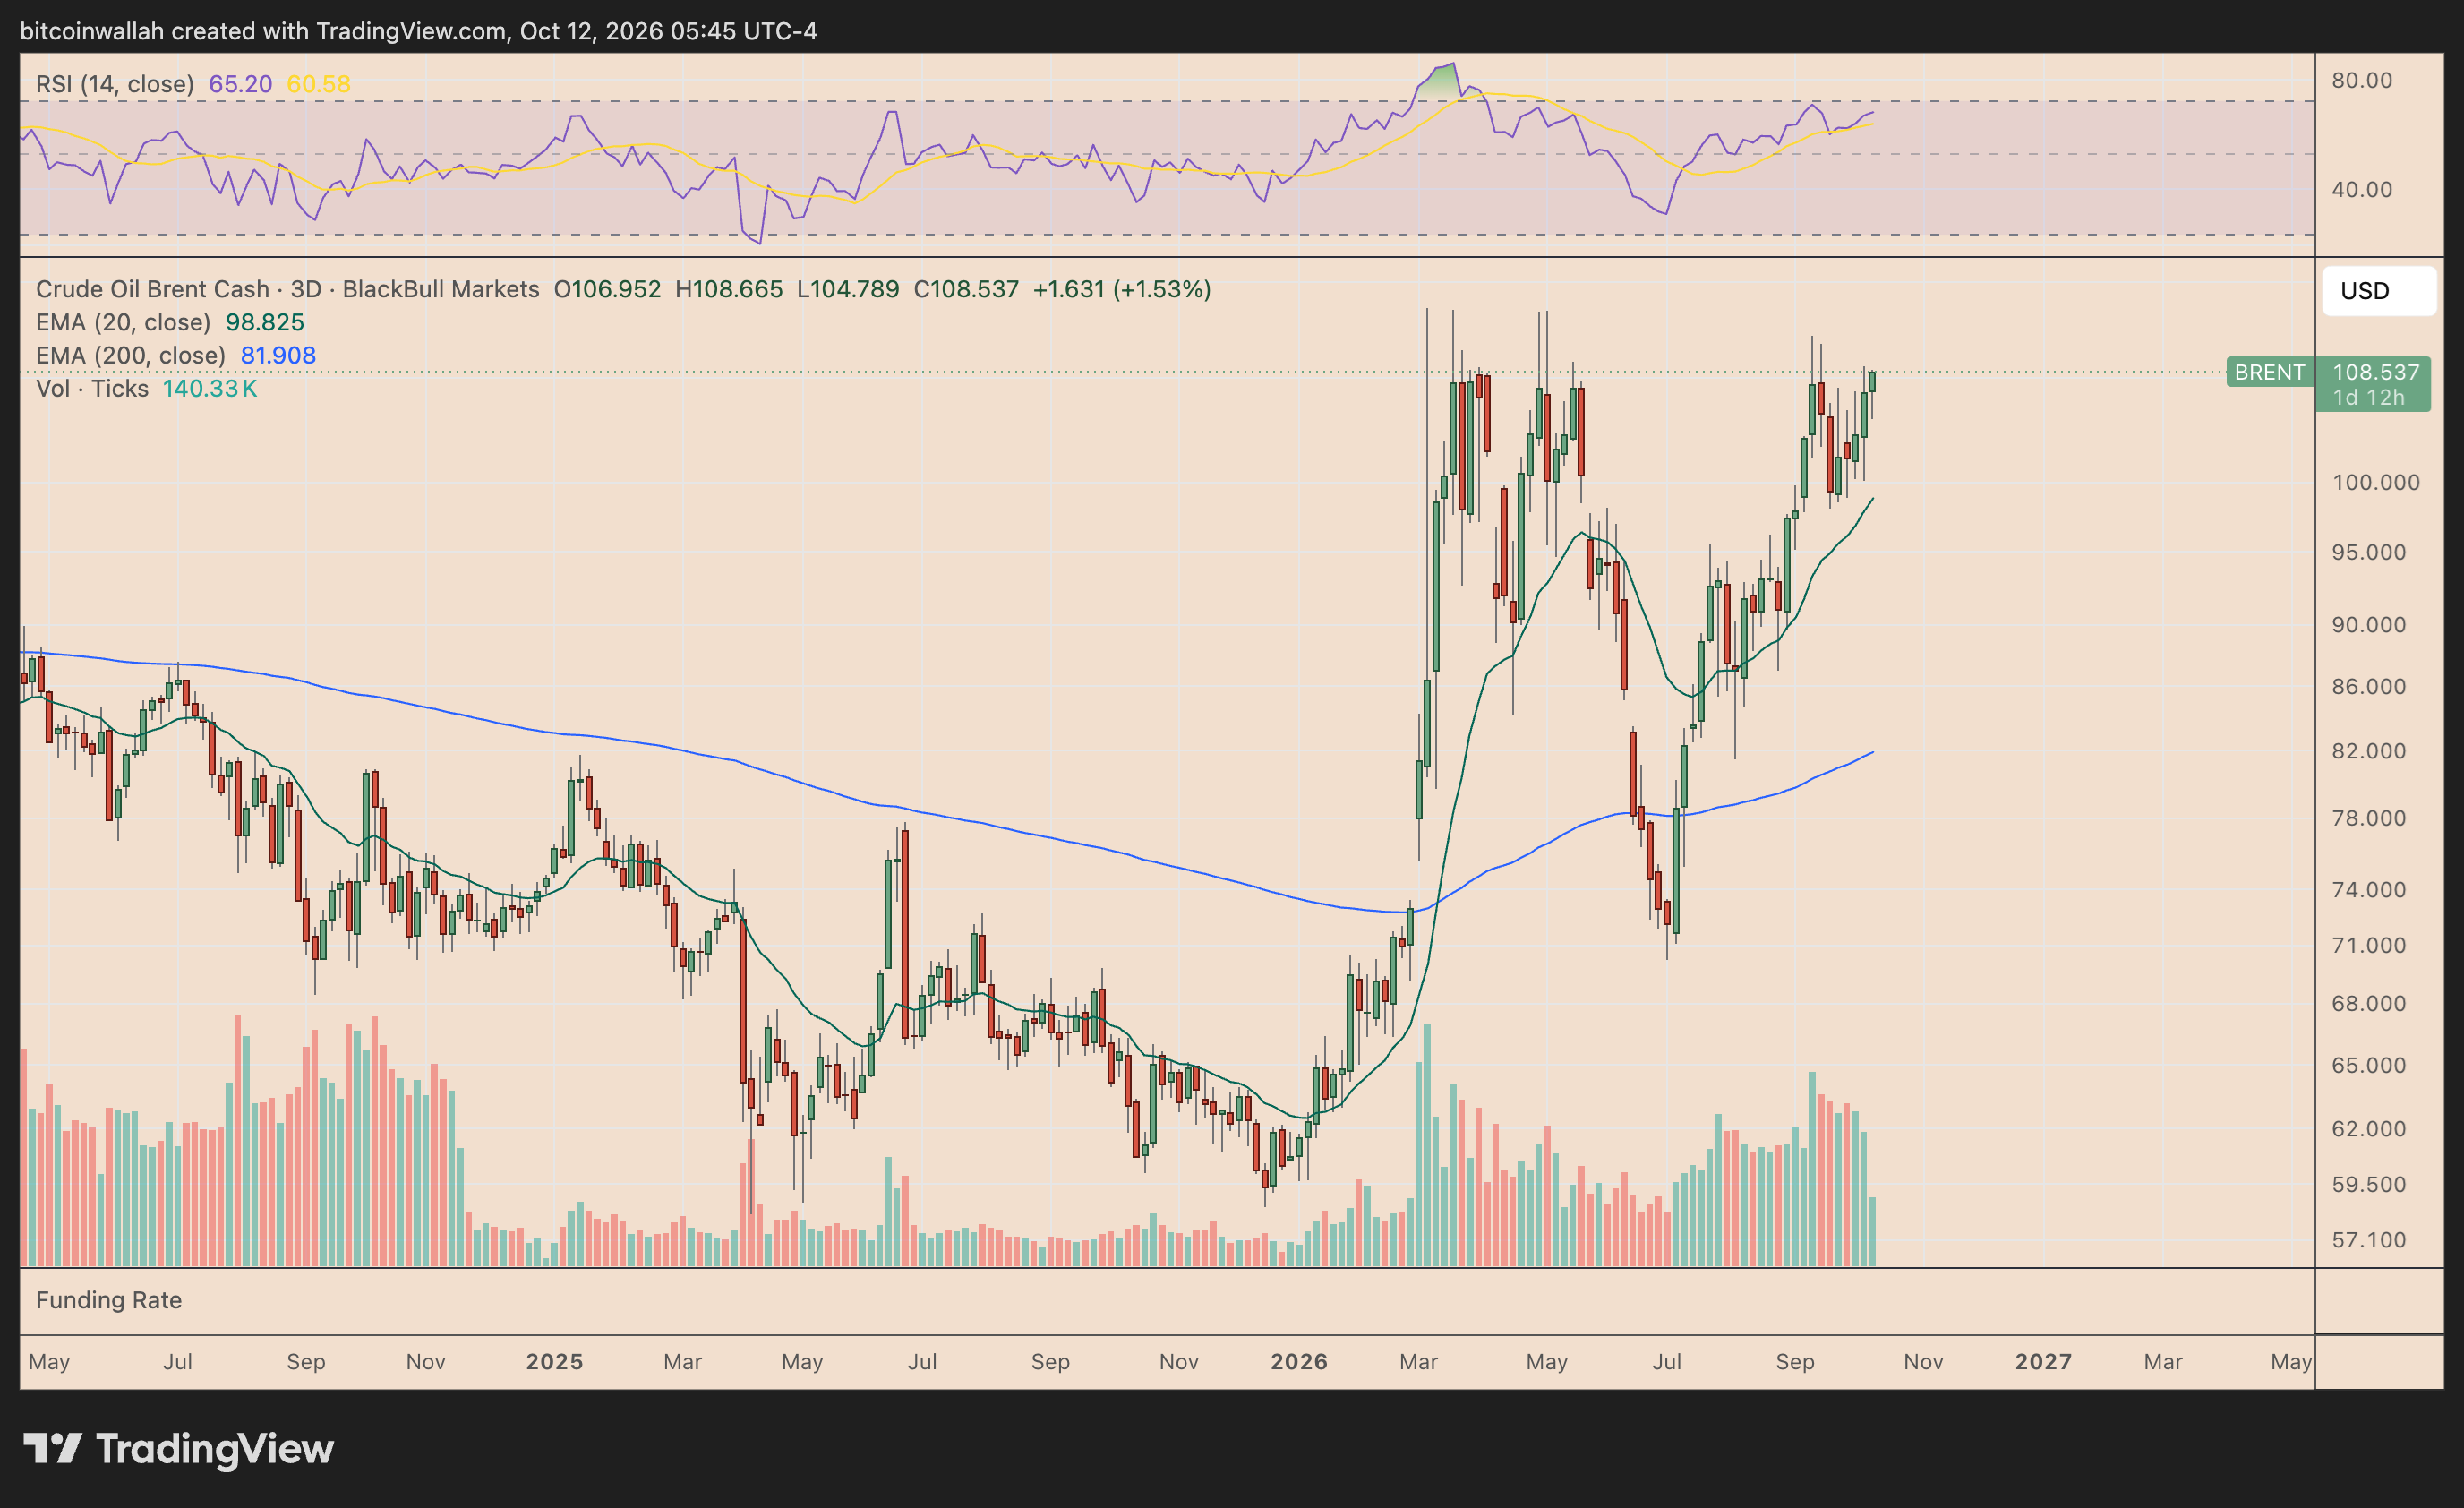
Elevated US Treasury yields, high oil prices, slowing spot Bitcoin ETF inflows, and profit-taking have weighed on BTC, leaving leveraged positions vulnerable to liquidations.
However, some macroeconomic pressures appear to be easing.
As of Oct. 12, markets were pricing in roughly an 18% probability of a Federal Reserve interest rate hike in October, while Brent crude had retreated from nearly $110 to around $103 per barrel.
The Nov. 3 US midterm elections could provide another catalyst. Greater political clarity after the vote may encourage investors to reassess risk exposure, although uncertainty surrounding the closely contested Senate remains.
On-chain indicators also suggest improving conditions.
According to xWIN, Bitcoin exchange reserves remain relatively low despite a recent rebound, indicating that selling pressure from readily available exchange supply remains contained.
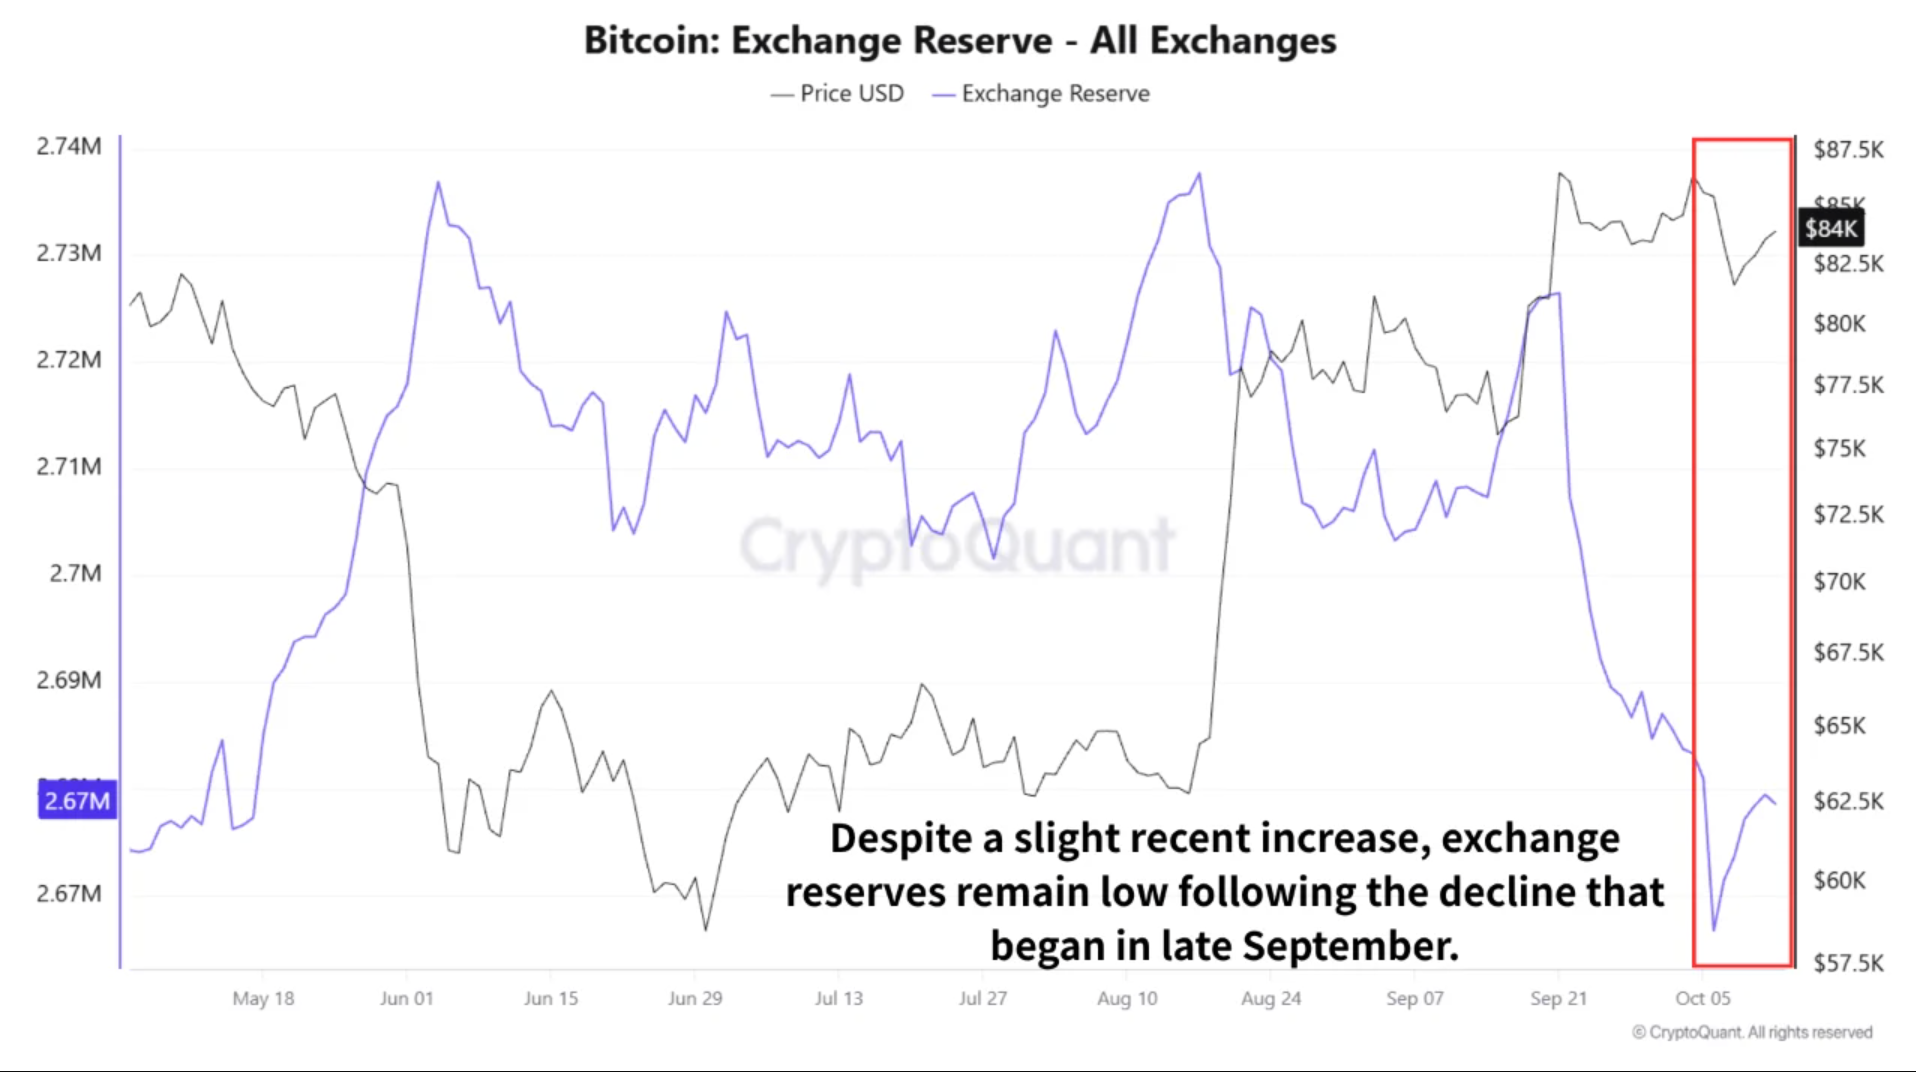
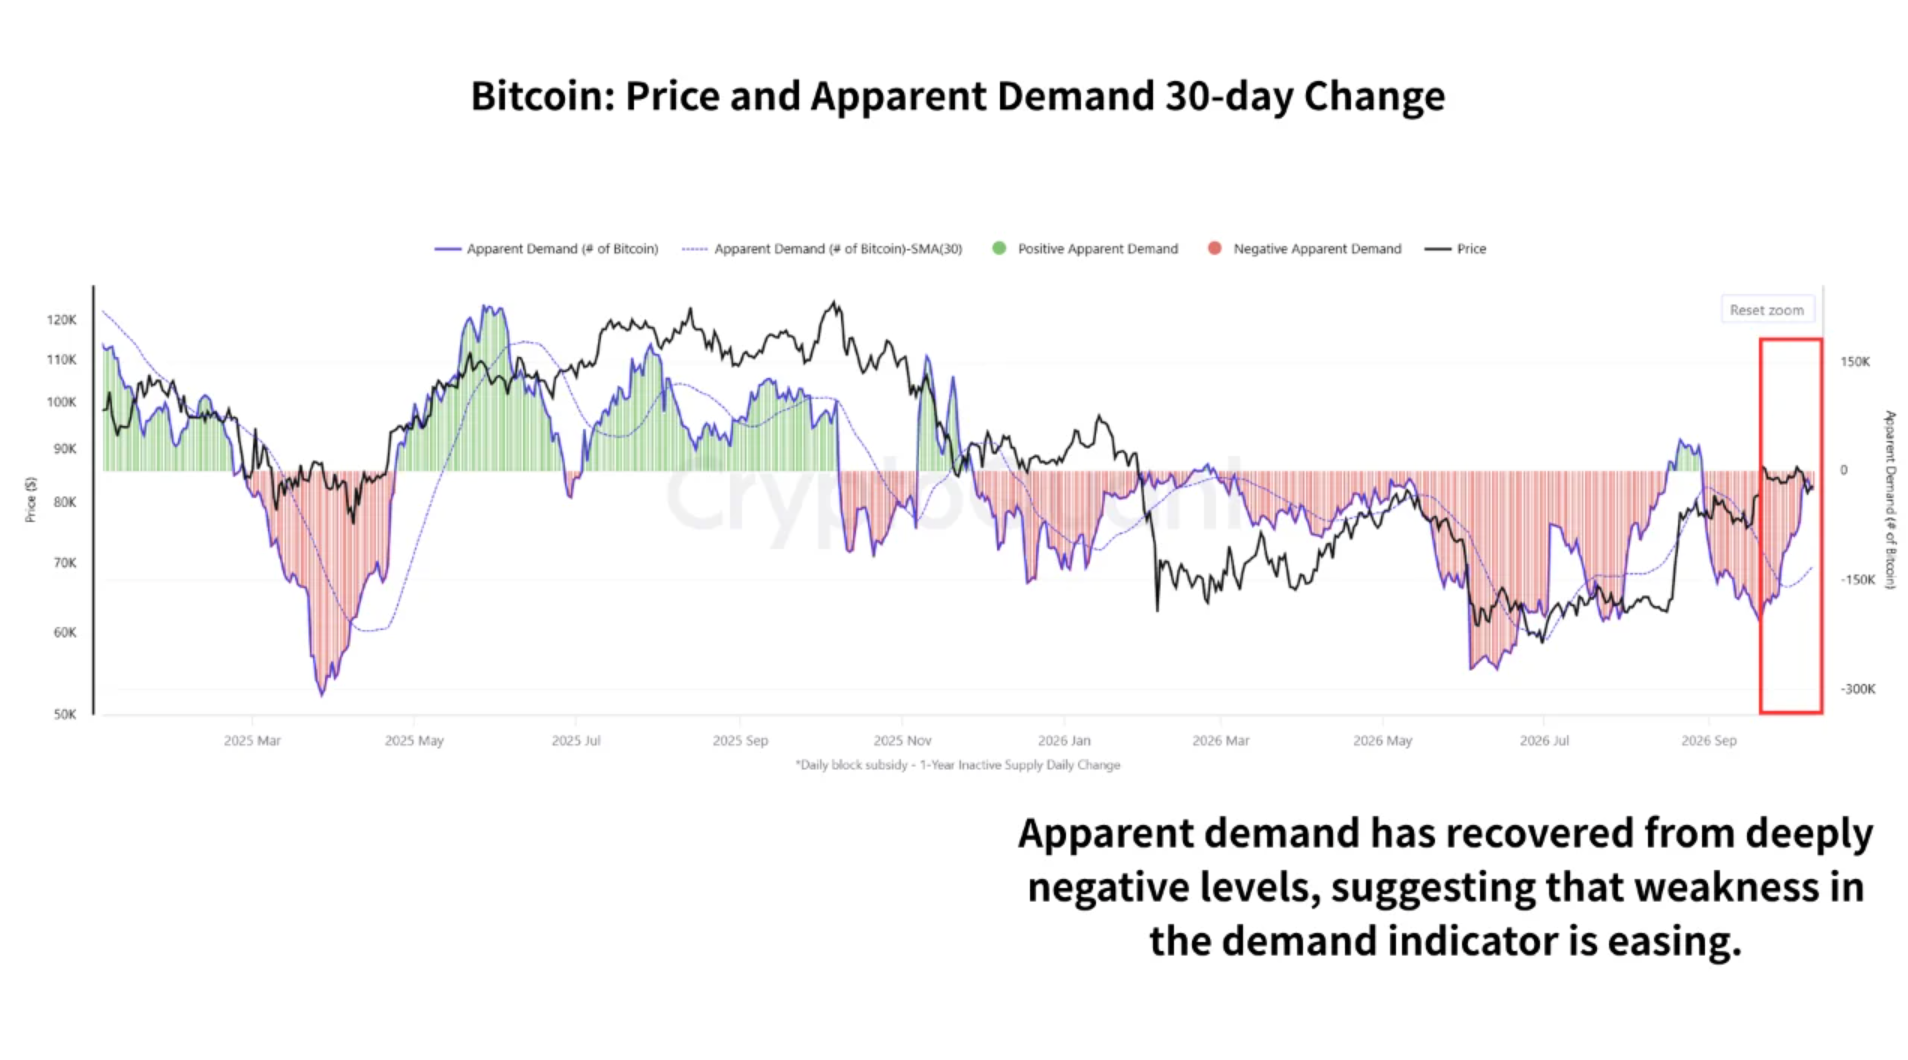
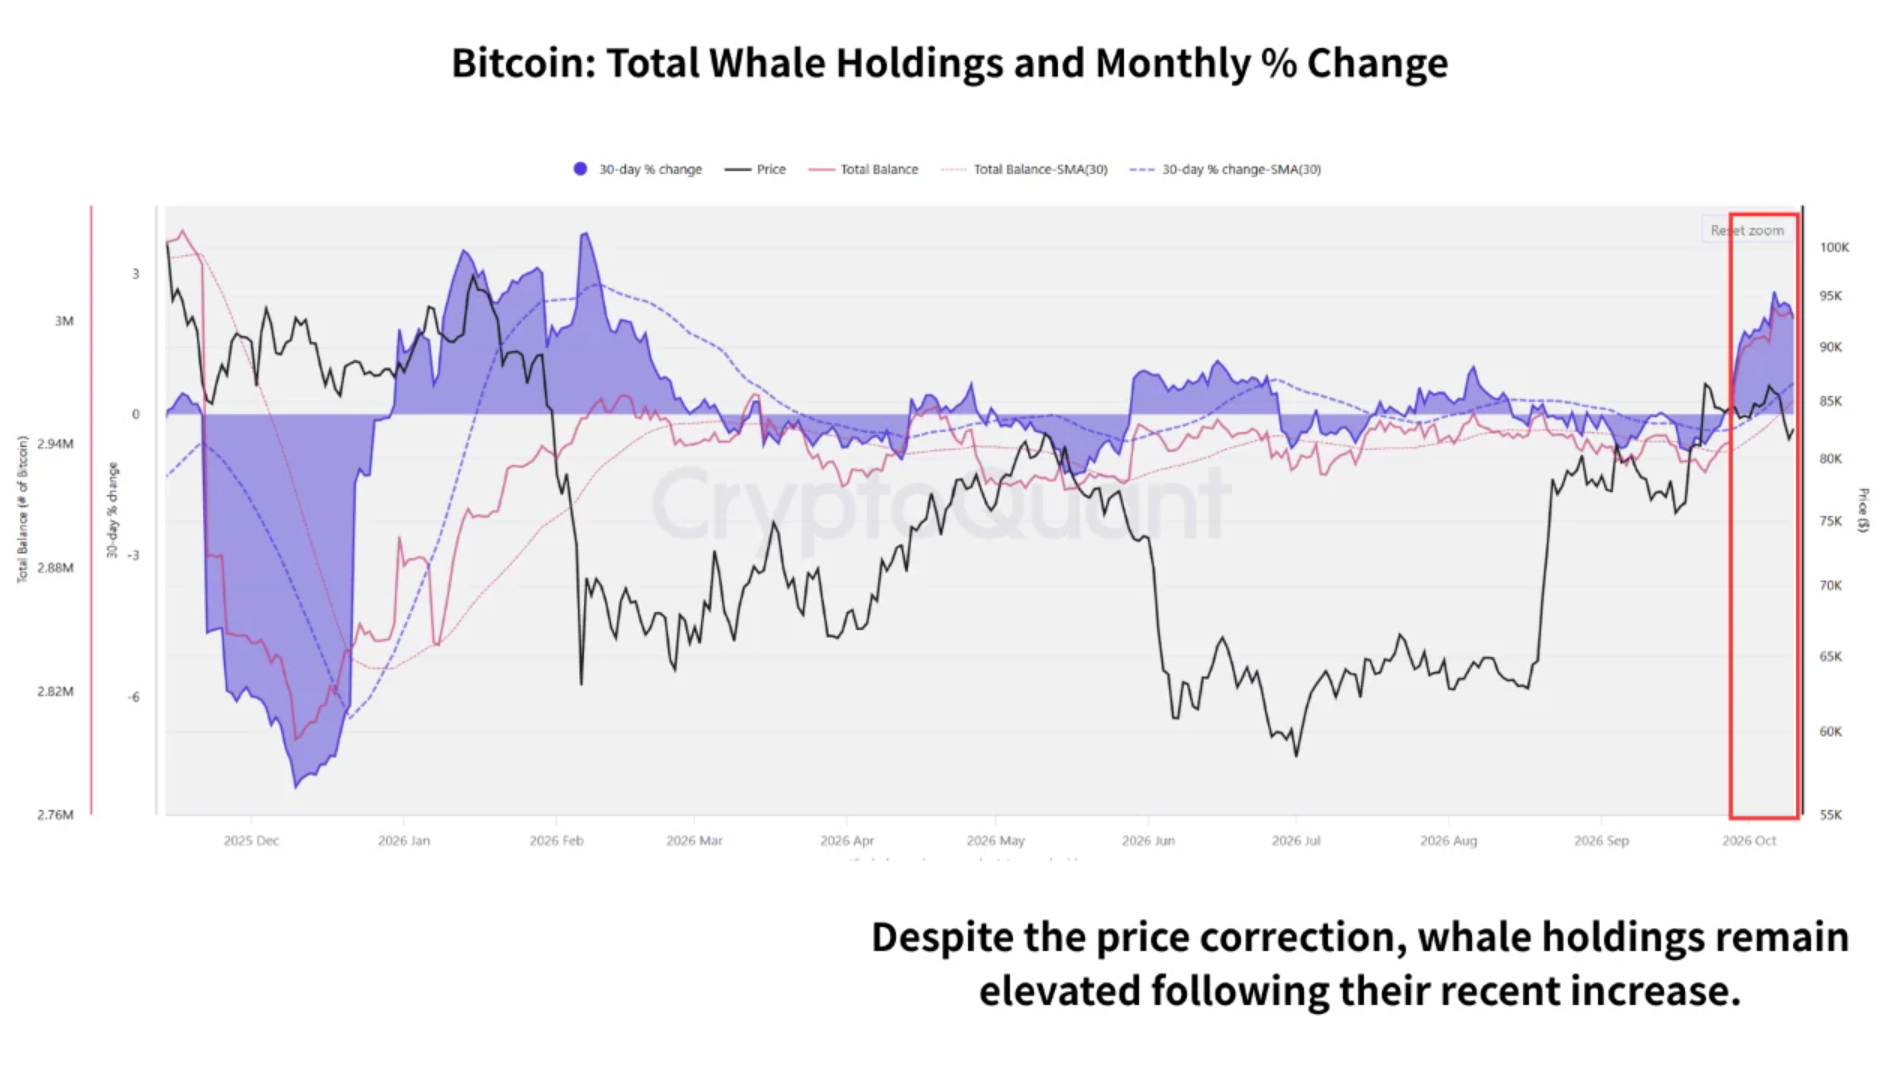
Together, these developments strengthen the case for a potential October bottom, complementing Bitcoin’s emerging golden cross.