


Breakout Builds on Rising Channel Momentum
CECO Environmental Corp. (CECO) develops equipment and services for air pollution control, fluid handling, and separation and filtration applications in industrial settings. The company’s stock is showing signs of bullish continuation after a second upside breakout from a rising trend channel that initially triggered in early May on relatively strong volume.
After two weeks of consolidation following that advance, CECO advanced to a new record high of $90.42 on Tuesday, before closing at its highest daily closing price on record at $89.87. In addition, the advance triggered a breakout from a cup-with-handle basing pattern, further reinforcing the improving bullish structure that has been developing since the early May channel breakout.
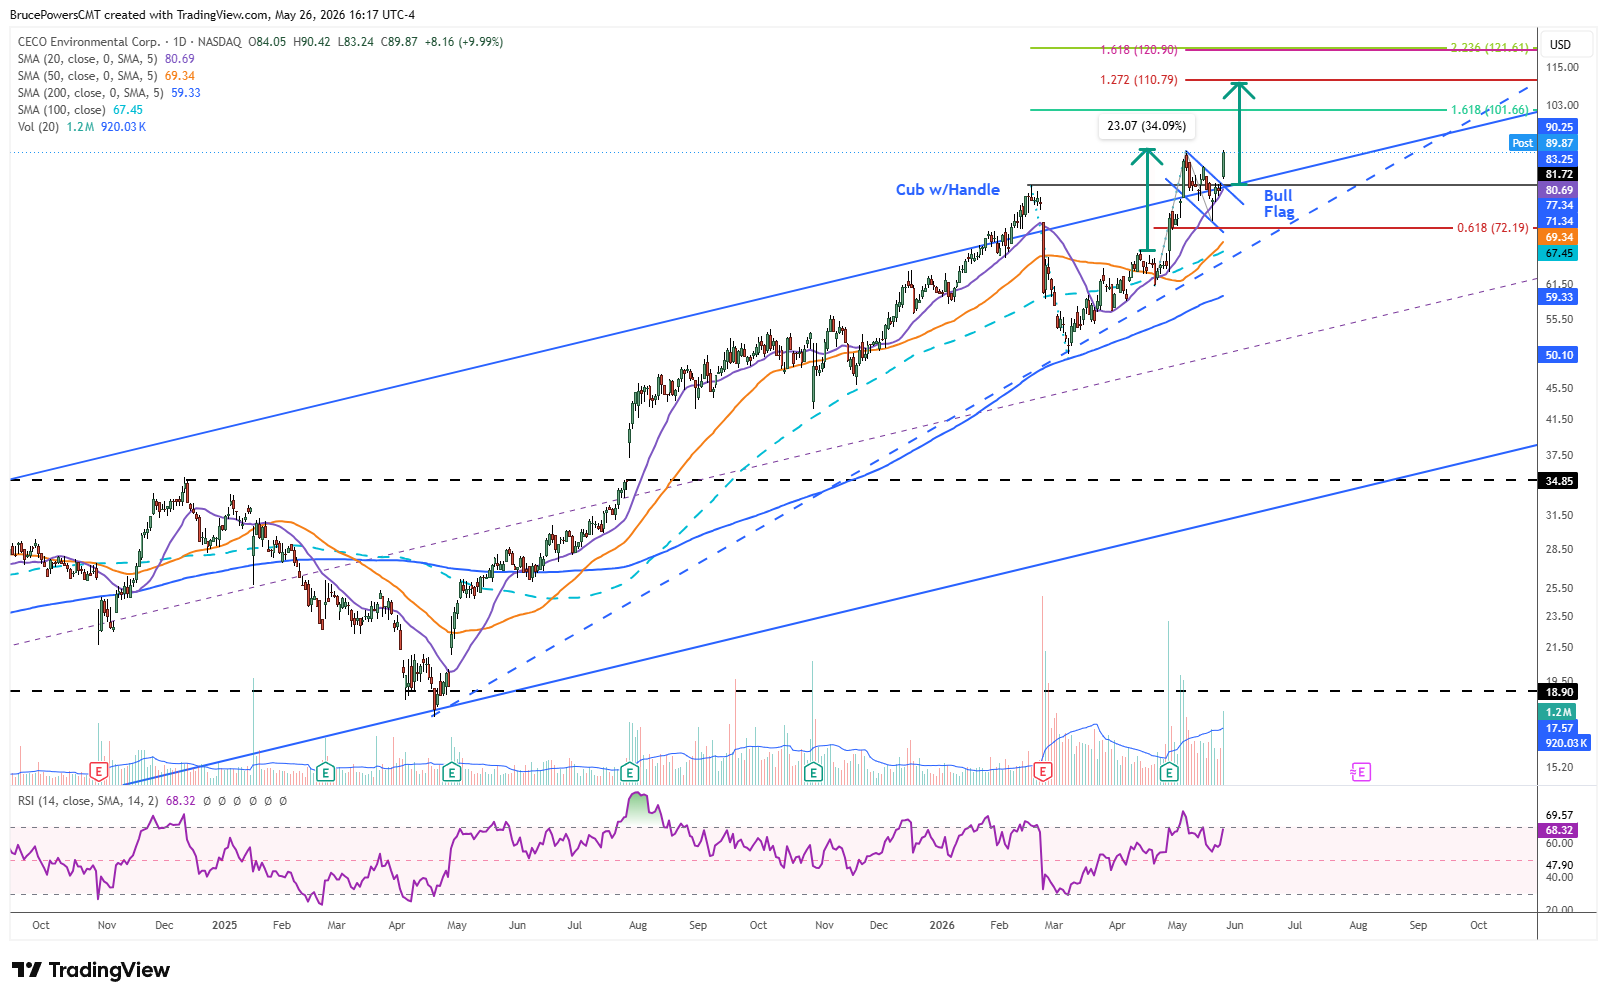
Bull Flag Confirms Strengthening Trend
On the daily chart, CECO triggered a breakout of a bull flag formation on Monday following a move above the confluence of a four-day high of $82.43, the upper declining boundary line of the pattern, and previous structure from the February peak of $81.72. The strength of that breakout was subsequently confirmed by a bullish reversal signal triggered by a rally above the lower swing high of $86.45. The flag formation also represents a high handle within the cup-with-handle base.
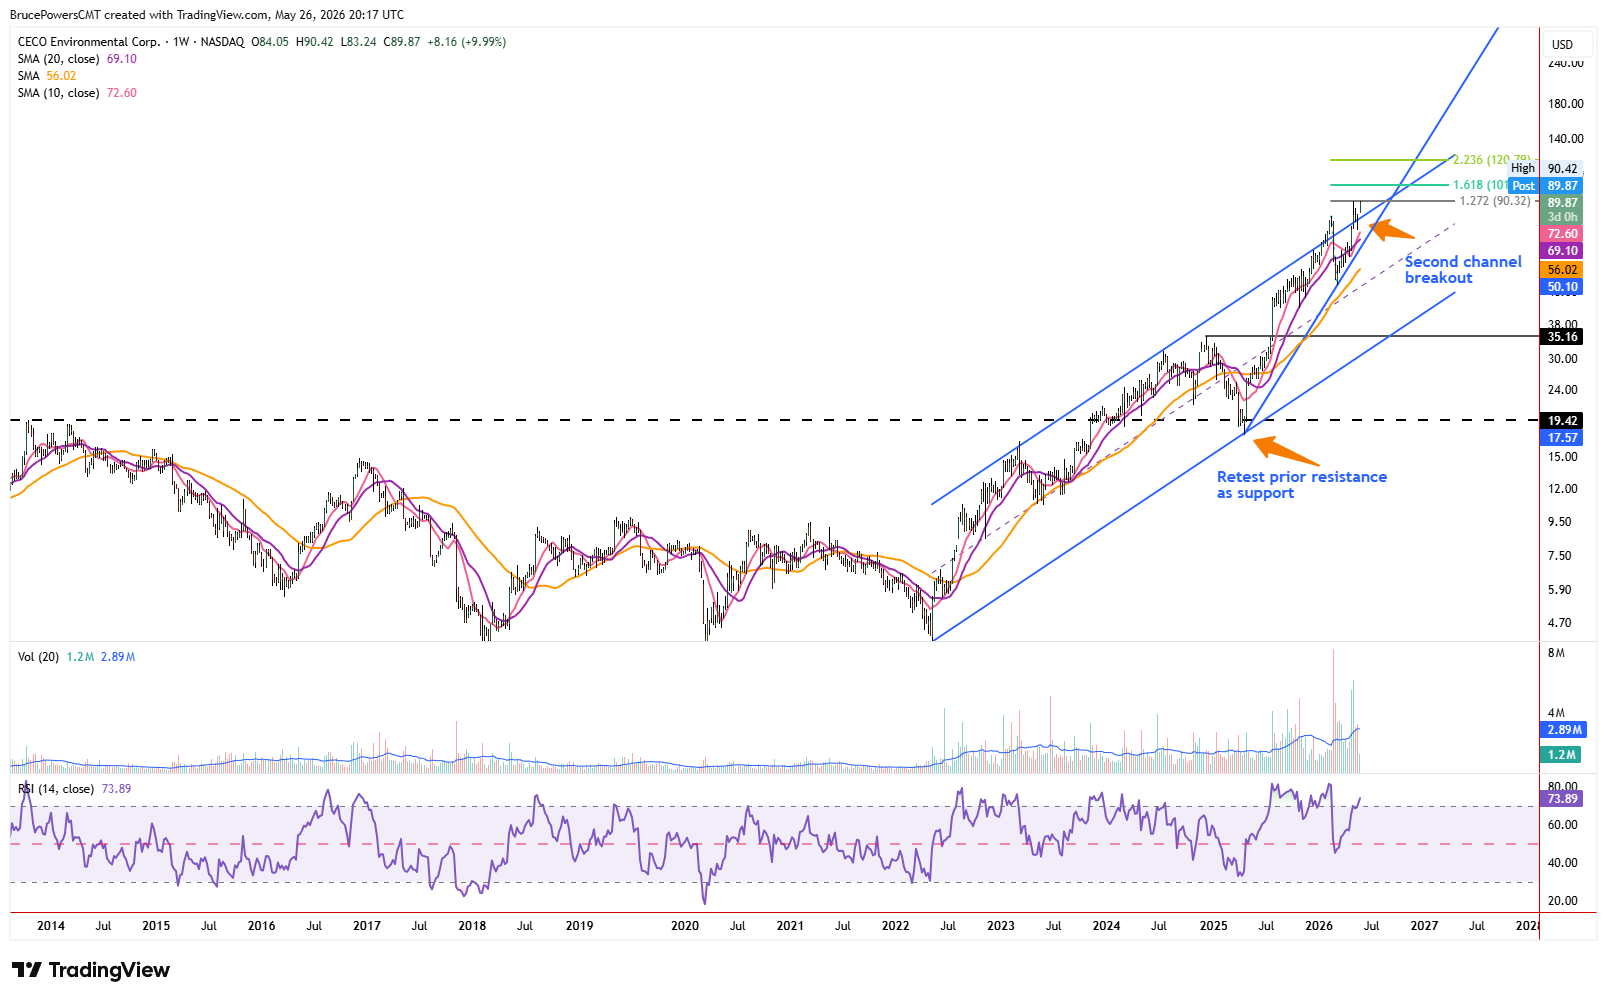
This analysis suggests that a new leg up in CECO has likely begun, reflecting a bullish continuation of both the short-term and long-term trends. The flag breakout follows an approximate 61.8% Fibonacci retracement of the prior advance and a successful test of support near the 20-day moving averages over several days. Also, notice that the 20-day moving average is currently at $80.61, continues to rise and is approaching the top channel line, further validating improving demand.
Fibonacci Targets Point Toward Further Upside
There are several potential upside initial target zones that stand out. The first is the 161.8% Fibonacci extension of the decline that created the left side of the cup at $101.66. That level is followed by the confluence of two indicators from around $109.63 to $110.79, consisting of an initial measured move target for the bull flag formation and the 127.2% projection of a rising ABCD pattern, respectively. Those upside targets align with the broader bullish continuation thesis introduced by the early May channel breakout and reinforced by this week’s historic closing high.