
Advertisement
Advertisement
Comex Gold Futures (GC) Technical Analysis – November 25, 2015 Forecast
By:
February Comex Gold futures rallied nearly 1 percent on Tuesday, driven by short-covering in front of a six-year low. The catalyst behind the move was
February Comex Gold futures rallied nearly 1 percent on Tuesday, driven by short-covering in front of a six-year low. The catalyst behind the move was tensions between Turkey and Russia. The news that Turkish fighter jets had shot down a Russian-made warplane near the Syrian border sparked a flight to safety among investors, pressuring the U.S. Dollar. Gains were capped, however, from expectations the Fed will raise interest rates in December. Gold could continue to post gains this week if the dollar continues to weaken.
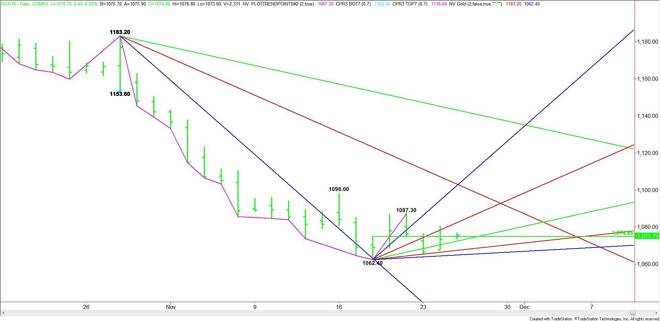
Technically, the main trend is down according to the daily swing chart, but downside momentum appears to be waning due to the light short-covering.
The minor range is $1062.40 to $1087.30. Its pivot or 50% level at $1074.80 is controlling the short-term direction of the market. Based on the close at $1073.30, the direction of the market today is likely to be determined by trader reaction to the pivot.
A sustained move over $1074.80 will signal the presence of buyers. This could trigger a rally into the steep uptrending angle at $1082.40. Overcoming this angle will put gold in a position to accelerate to the upside.
Overtaking the angle at $1082.40 with conviction could fuel a move into the minor top at $1087.30. This level is also a trigger point for a possible acceleration into a potential resistance cluster at $1102.40 to $1103.20. This is the best upside target today, but without the return of volatility, the market is not likely to reach it.
A sustained move under $1074.80 will signal the presence of sellers. The first downside target is an uptrending angle at $1072.40. This is followed by a pair of uptrending angles at $1067.40 and $1064.90. The latter is the last potential support angle before the $1062.40 main bottom.
Watch the price action and read the order flow at $1074.80 today. Trader reaction to this level will tell us whether the bulls or the bears are in control.
About the Author
James Hyerczykauthor
James Hyerczyk is a U.S. based seasoned technical analyst and educator with over 40 years of experience in market analysis and trading, specializing in chart patterns and price movement. He is the author of two books on technical analysis and has a background in both futures and stock markets.


Advertisement