GBP/USD bullish breakout of the triangle chart pattern failed and turned out to be a false breakout. What is the next step with the Coronavirus spreading?
Dear traders, the GBP/USD bullish breakout of the triangle chart pattern failed and turned out to be a false breakout. What is the next price swing for the Cable now that the bulls have lost control?
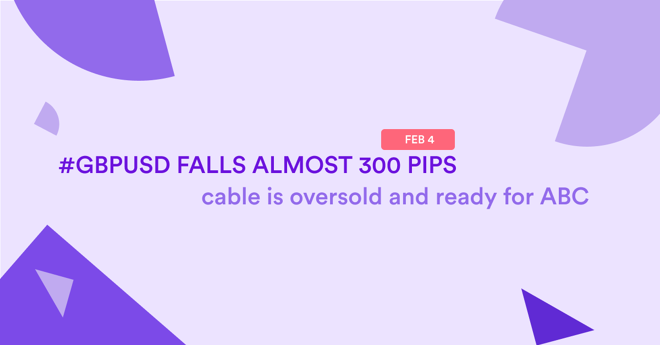
The GBP/USD made a picture perfect ABCDE triangle chart pattern and price action moved almost exactly as our wave patterns expected. The ABCDE were completed and a strong push up seemed to confirm the bullish wave 1. With more than 10 correct analyses in row though, 1 incorrect is I guess a question of time. The breakout turned out to be a false one and price has been falling quickly instead. It seems that Coronavirus is pushing the USD up. That means that the GBP/USD could now be building a complex WXY (green) correction instead. The bearish breakout below the support trend line (dotted blue) could indicate a decline towards the Fibonacci levels of wave 4 vs 3.
The GBP/USD seems to be building a bearish 5 wave pattern (dark red). Price could still be pushing lower within the wave 5 or eventually build a bullish ABC correction within wave B (orange). Price is expected to turn back down without breaking the top and 100% Fib because that would invalidate (red x) the ABC zigzag.
Chris Svorcik is co-founder, trader, and analyst with Elite CurrenSea (www.EliteCurrenSea.com) since 2014.