Advertisement
Advertisement

Crude Oil Forecast by 3, 2017, Technical Analysis

By: 
Christopher Lewis
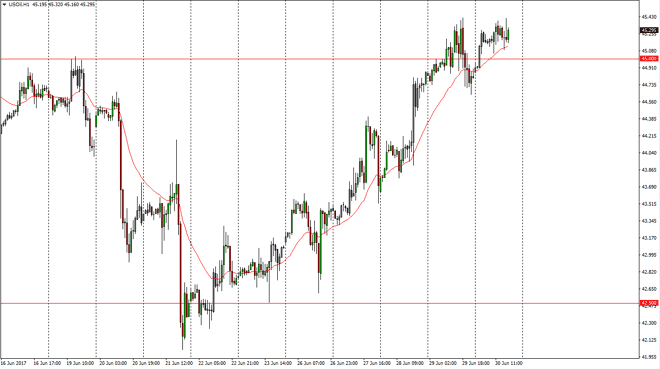
Crude Oil daily chart, July 03, 2017

WTI Crude Oil The WTI Crude Oil market rallied a bit on Friday, breaking through the $45 level again. However, we do see a significant amount of

WTI Crude Oil

The WTI Crude Oil market rallied a bit on Friday, breaking through the $45 level again. However, we do see a significant amount of resistance near the $45.50 level, and the fundamental situation for oil is not good. I’m looking for some type of breakdown to continue the selling, or exhaustion above. I don’t have any interest in buying anytime soon as crude oil oversupply continues.

Loading

Crude Oil Inventories Video 03.7.17

Brent

Brent markets rallied as well, testing the $48 level. The 24-hour exponential moving average is offering support on the short-term charts, but longer-term I believe that the sellers will return, and send this market down to the $47 level. I believe that oil continues to be a market that can be sold on rallies longer-term as the structural issues continue.
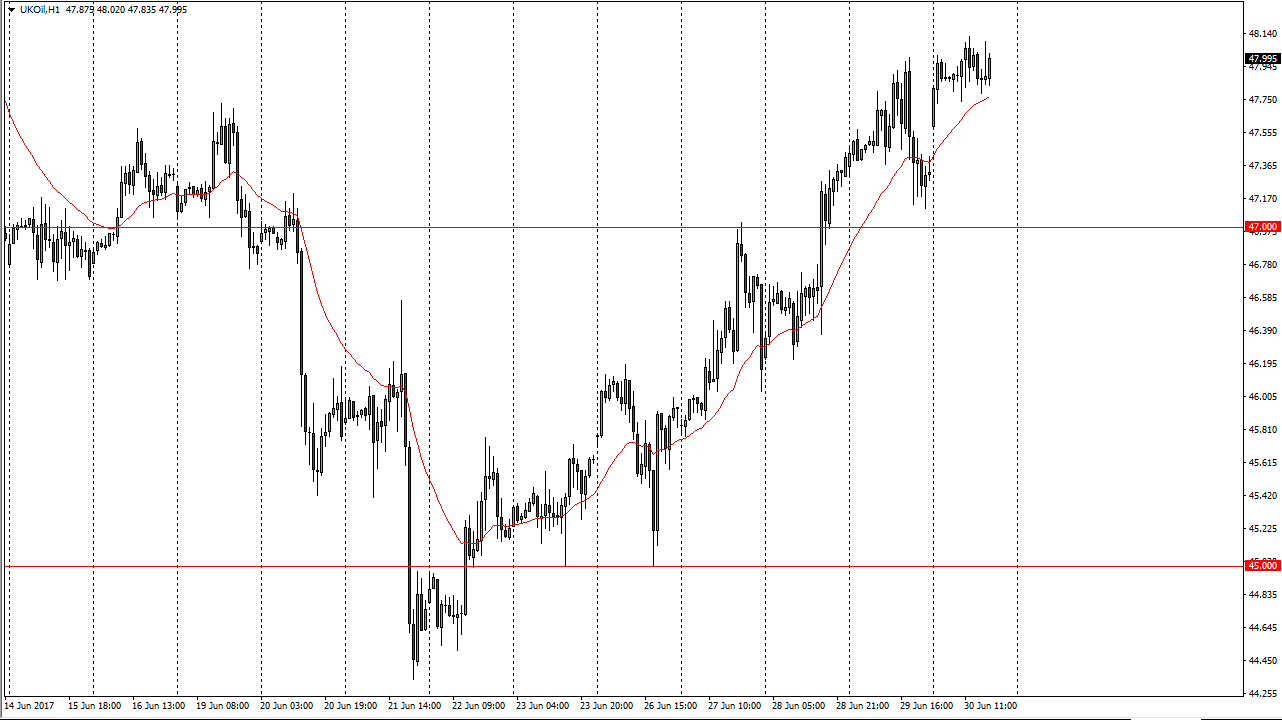
Brent daily chart, July 03, 2017
Loading

About the Author

Christopher LewisSenior Analyst

Chris is a proprietary trader with more than 20 years of experience across various markets, including currencies, indices and commodities. As a senior analyst at FXEmpire since the website’s early days, he offers readers advanced market perspectives to navigate today’s financial landscape with confidence.

Latest news and analysis

    Loading
Advertisement
Loading
Advertisement
Advertisement
Advertisement
Advertisement