Zcash (ZEC), the leading privacy coin by market cap, extended its decline on Wednesday, dropping by over 4% to around $510. That was down circa 15% from the local high of around $590, established a week ago.

The correction put ZEC’s cup-and-handle breakout thesis at risk of invalidation. Instead, it is leading to the validation of multiple bearish reversal patterns, with downside targets under the key $500 support level.
Let’s examine.

ZEC Symmetrical Triangle Breakdown Targets $480
ZEC’s four-hour chart shows the price breaking below the lower trendline of a symmetrical triangle near $535–$538.
A symmetrical triangle forms when price consolidates between converging support and resistance trendlines. The pattern typically resolves in either direction.

In ZEC’s case, the price has broken below the lower trendline, suggesting sellers have gained control after several failed attempts to reclaim the $560–$580 region.
The pattern’s measured downside target sits near $480–$485, calculated by subtracting the triangle’s maximum height from the breakdown point. That would represent an additional decline of roughly 5%–6% from current levels.
ZEC has also slipped below its 20- (green), 50- (red), and 100-period (blue) exponential moving averages (EMAs). These indicators are clustered between approximately $518 and $539, creating a resistance zone that could limit any short-term rebound.
Meanwhile, the 200-period EMA (blue) near $496 is emerging as the next immediate support. A decisive close below the moving average would strengthen the case for a decline toward the triangle target near $480.
Still, ZEC’s four-hour relative strength index has dropped toward 32, just above the oversold threshold of 30. That could trigger a relief bounce or a retest of the broken triangle support.
A recovery above $540–$545 would weaken the breakdown thesis. Until then, ZEC remains exposed to further losses if it falls below $500.
ZEC Ascending Channel Signals a Deeper Pullback
ZEC’s daily chart also supports the possibility of a deeper correction within its prevailing ascending channel.
The price recently faced rejection near the channel’s upper boundary and the 0.236 Fibonacci retracement level around $575, showing that buyers struggled to sustain momentum above $560.
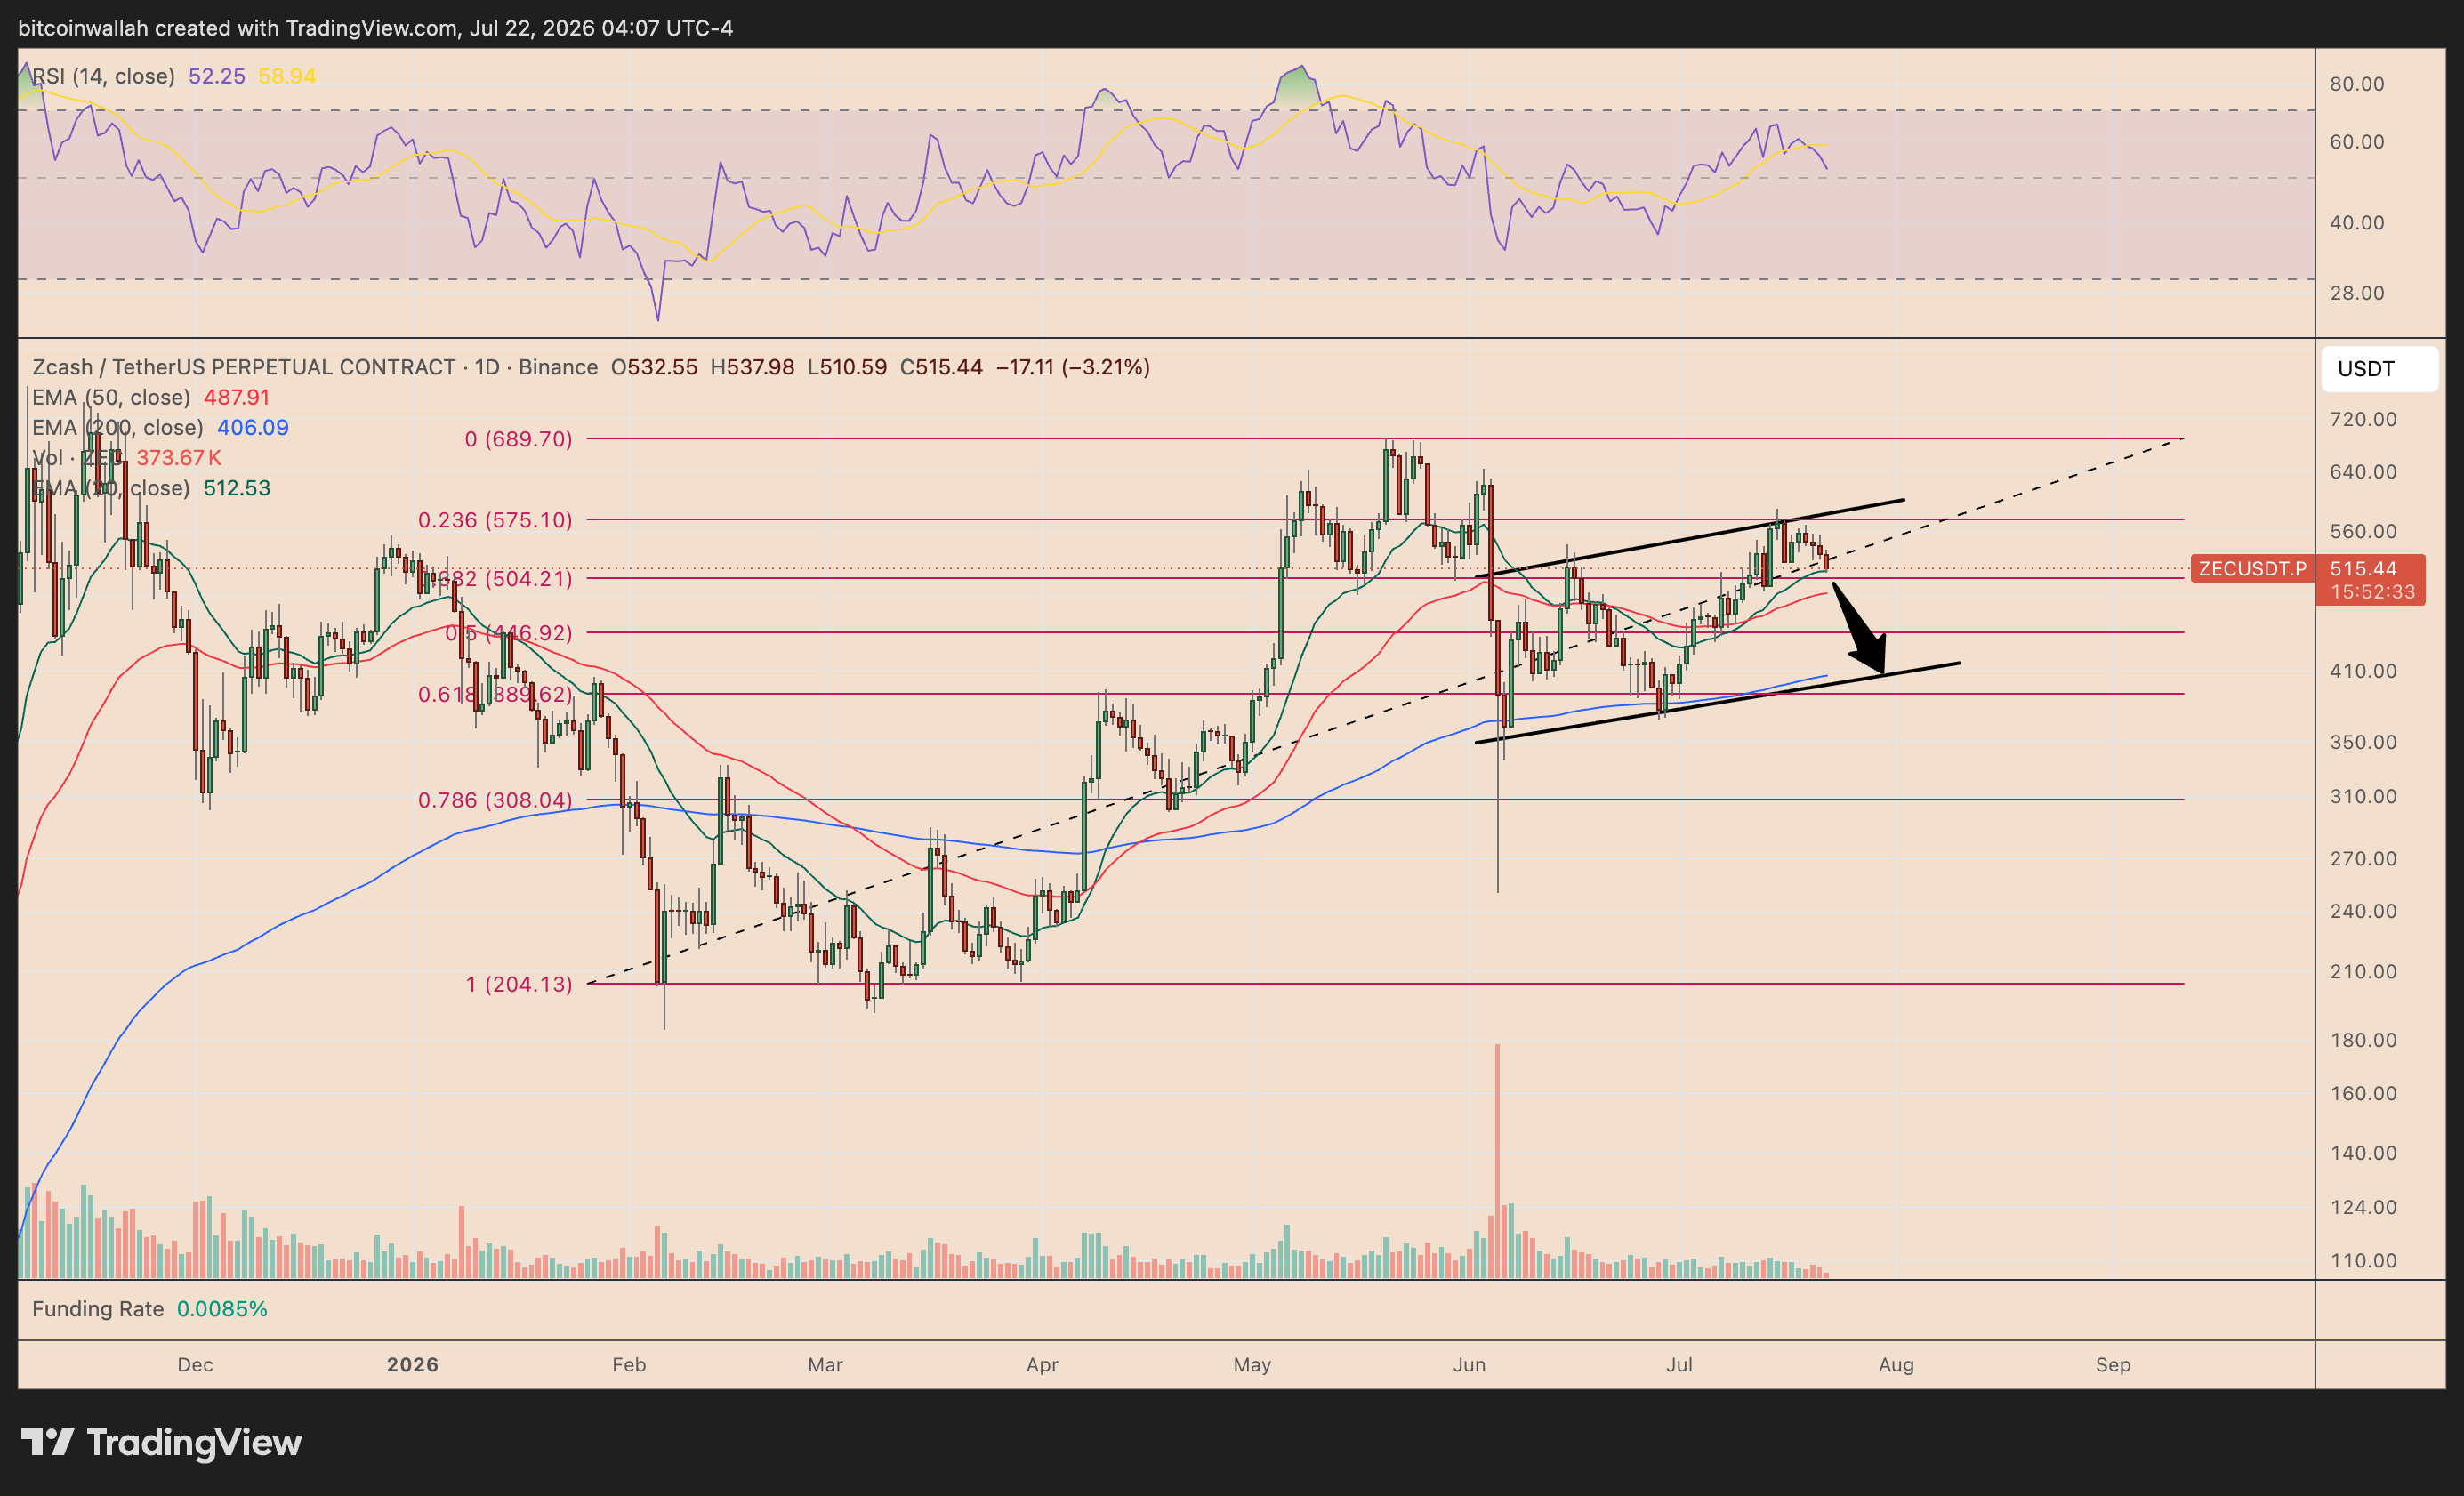
ZEC has since fallen toward its 20-day EMA (green) near $512, while the daily RSI has turned lower toward 52.
Further selling may push ZEC toward the channel’s lower trendline around $405–$420. This area overlaps with the 200-day EMA (blue) near $406 and could act as a stronger support zone.
A recovery above $560–$575 would weaken the bearish outlook and reopen the path toward the channel’s upper boundary.