
Advertisement
Advertisement
Crude Oil forecast for the week of December 12, 2016, Technical Analysis
Updated: Dec 12, 2016, 09:11 GMT+00:00
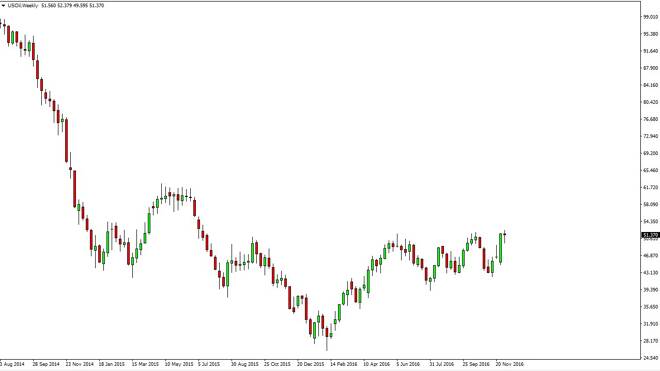
WTI Crude Oil The WTI Crude Oil market went back and forth during the week, testing the $52 level on the top, and the $50 level on the bottom. During the
WTI Crude Oil
The WTI Crude Oil market went back and forth during the week, testing the $52 level on the top, and the $50 level on the bottom. During the weekend, we have a meeting between OPEC and non-OPEC countries, discussing a possible deal for the non-OPEC countries to join the OPEC-led production cuts. This of course has quite a bit of an effect on the supply and demand picture, which of course will move prices themselves. The US dollar is a bit of a head window, as it continues to strengthen. If it continues to do the same thing, that might be enough to temper the rally after a production cut agreement, at least longer-term.
Brent
Brent markets of course do the same thing over the longer term, and I believe that if we see the meeting end up solving nothing, then the bread market will probably turn right back around to fall to the $46 level which is the base of the previous week’s candle. At that point, there seems to be quite a bit of support, and I think that it would probably take another reason to push lower, perhaps the US dollar strengthening. On the other hand, if we do break above the top of their weekly candle for this past week, we could reach towards the $60 level, and then possibly even the $65 level above there. Ultimately, this is a market that should continue to show volatility regardless of what happens. I do recognize that their longer-term structural issues when it comes to crude oil, especially because the United States and Canada will have nothing to do with a production cut, and that the rig count should continue to rise as the prices are doing the same. After all, shell producers are suddenly finding that they can make a little bit of money drilling now. With this, there will be a longer-term overhang, and of course apply being lower will help, but there is a significant lack of demand at the same time.
Related Articles
Oil Technical Analysis Forecast
About the Author
Christopher Lewisauthor
Chris is a proprietary trader with more than 20 years of experience across various markets, including currencies, indices and commodities. As a senior analyst at FXEmpire since the website’s early days, he offers readers advanced market perspectives to navigate today’s financial landscape with confidence.


Advertisement