


Breakdown From Symmetrical Triangle Support
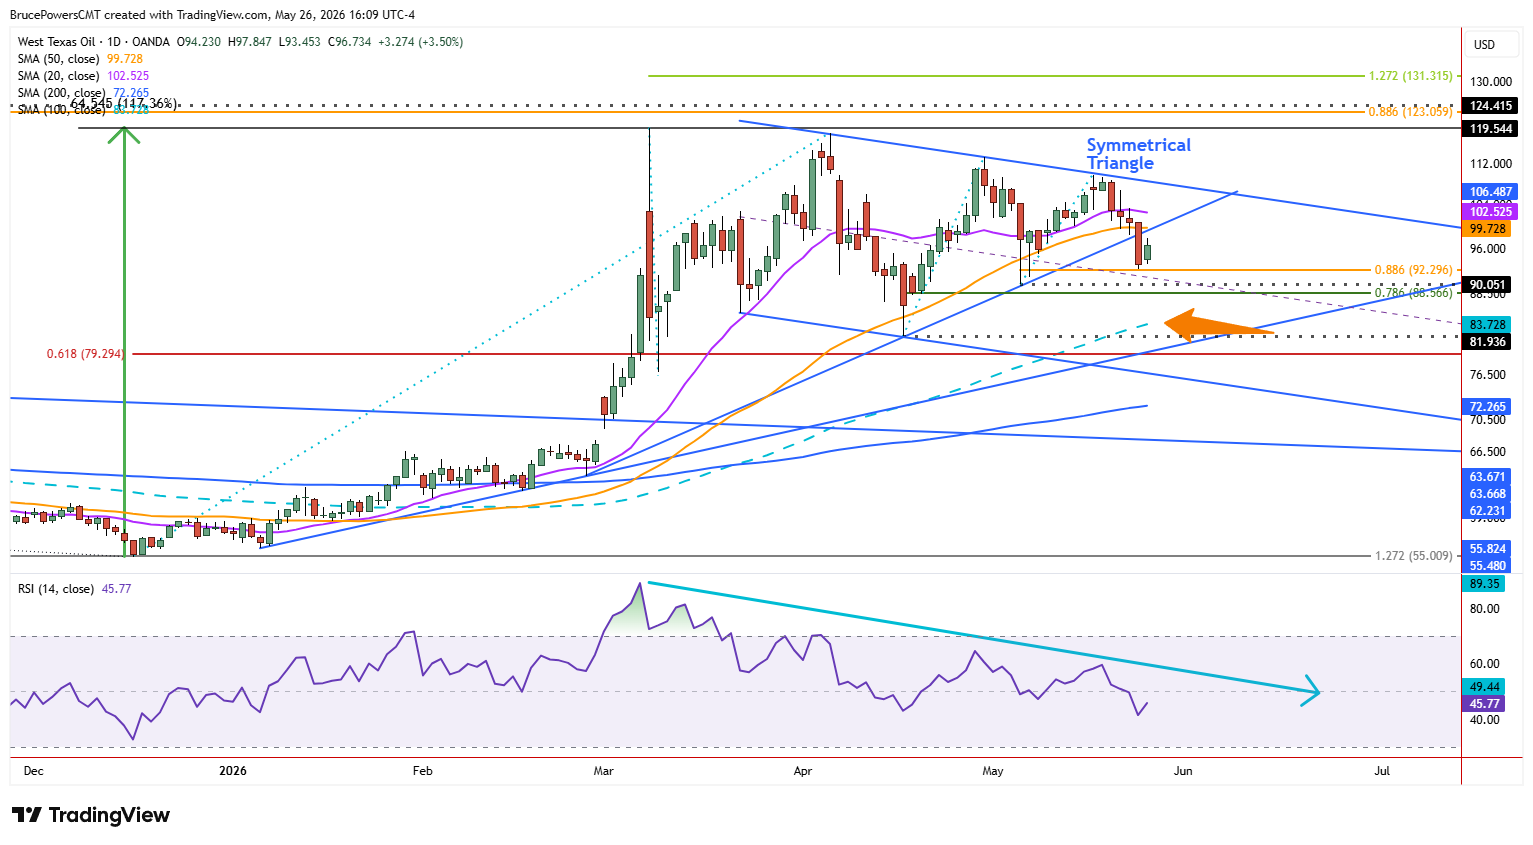
Crude oil broke down from a symmetrical triangle consolidation pattern during Monday’s session, as it fell below the uptrend line and 50-day moving average support. The bearish decline subsequently found support at a low of $92.51, completing an 88.6% Fibonacci retracement of the prior advance. A daily close below the trendline confirmed the breakdown. A bounce followed on Tuesday, generating an inside day, with a lower daily high of $97.85 and a higher daily low of $93.45.
Support Structure Under Pressure
This may be the beginning of a deeper pullback to test lower support levels. The next key support level is the higher swing low at $90.05, as a drop below it will signal a reversal of the bullish structure. While the 78.6% Fibonacci retracement at $88.57 marks the next potential support level, the rising 100-day moving average, now near $83.83, may have greater significance. This is particularly the case since the 100-day average has not been approached as support since bullish momentum kicked in early March. In addition, the 100-day average has risen above the next key structure support area near the higher swing low of $81.94.
Resistance Rebuilds Beneath Broken Trend
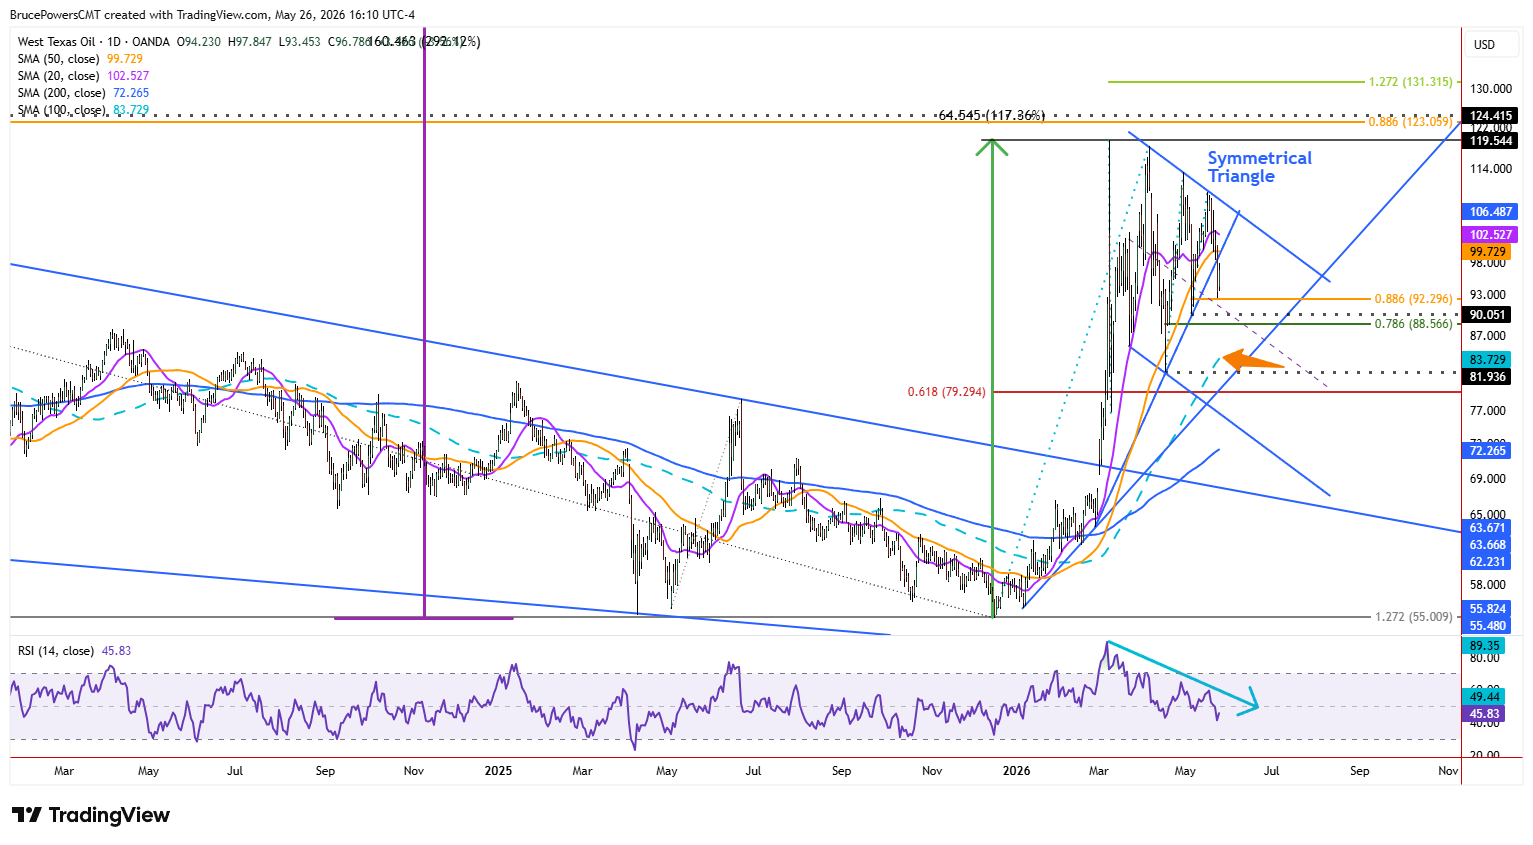
The 50-day moving average, currently converged with the uptrend line, is key dynamic resistance near $99.73. A sustained rally above that indicator would show returning strength. However, since it failed as support concurrent with the uptrend line, it marks key resistance for further strength that might test prior support as resistance. The minor bounce on Tuesday can be considered a successful test of resistance near the trendline.
Bearish Channel Extends Downside Outlook
There is also a falling channel on the chart that suggests a continuation to the downside, since a bearish reversal followed the most recent touch of the top channel boundary. That resulted in a lower swing high of $109.74. Once a reversal occurs from one side of the channel the other side becomes a possible target. That would validate the possibility of the 100-day moving average being reached, since it represents a higher support zone than the lower uptrend line.
If you’d like to know more about how commodity markets work, please visit our educational area.