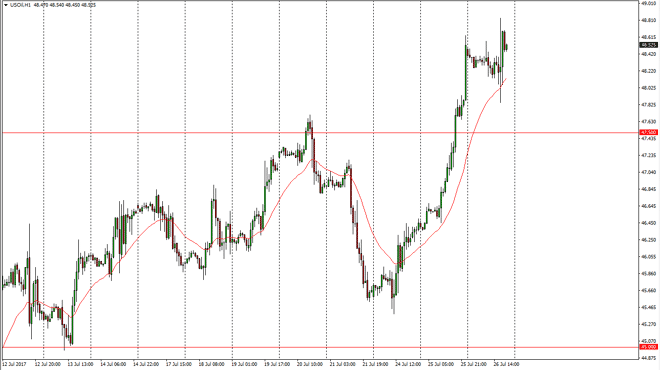
WTI Crude Oil The WTI Crude Oil market went sideways initially during Wednesday trading, but found buyers underneath. Because of this, looks as if the
The WTI Crude Oil market went sideways initially during Wednesday trading, but found buyers underneath. Because of this, looks as if the buyers are ready to jump back into this market and continue to push towards the $49 level. I ultimately am waiting to see the market reach towards the $50 level, where I would be more than willing to start shorting again. Alternately, if we break down below the $47.50 level, I would be a seller. Either way, although I recognize that the short-term is probably going to be a bit bullish, but I think that the real momentum will be to the downside on the longer-term charts as the oversupply issues will continue to be an issue. True, some OPEC members are starting to focus on cutting production even further, but quite frankly the shale producers in the United States will fill that void.
The print market went sideways as well, but continues to find the $50 level supportive. If we break down below there, that would be very negative and it should send this market looking towards the $47.75 level underneath. Alternately, if we do continue to go higher, I think there are several areas where we can see sellers jump into the market, so I would be a bit cautious although I certainly recognize that there is a significant amount of bullish pressure currently. I suspect that the $52.50 level above will be resistive, and therefore could be the next area where the sellers challenge the buyers. Short-term, if we continue higher I wouldn’t be overly concerned about buying, but longer-term I certainly think that the bearish pressure will come into play volatility continues to be the norm, but I still think that the oversupply issues will continue.
Chris is a proprietary trader with more than 20 years of experience across various markets, including currencies, indices and commodities. As a senior analyst at FXEmpire since the website’s early days, he offers readers advanced market perspectives to navigate today’s financial landscape with confidence.