
Advertisement
Advertisement
Crude Oil Price Forecast November 10, 2017, Technical Analysis
Updated: Nov 10, 2017, 04:35 GMT+00:00
WTI Crude Oil The WTI Crude Oil market went sideways during most of the session on Thursday, hugging the $57 handle. We broke above there later in the
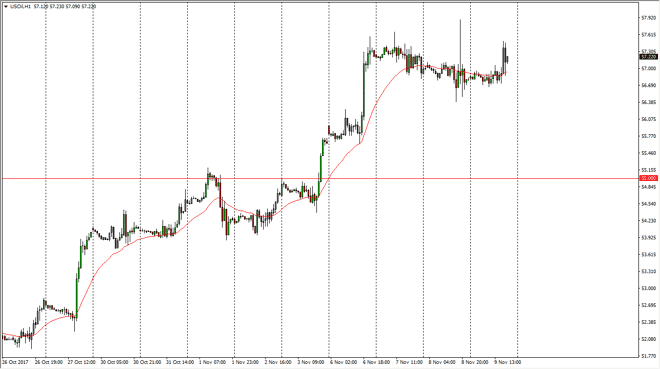
WTI Crude Oil
The WTI Crude Oil market went sideways during most of the session on Thursday, hugging the $57 handle. We broke above there later in the day, as the Americans picked up the slack, but I also see that there is a certain amount of resistance just above, especially near the $58 handle. Longer-term charts suggest that the $60 level above is probably the real target, but it may take a while to get there. We have gotten a bit ahead of ourselves in this rally, and I think that short-term pullbacks may continue to be something that you can count on seen. I believe that the $55 level underneath should be the floor, so therefore it’s not until we break down below there that I’m comfortable selling. I do not anticipate that we break through the $60 handle easily, but if we did rake above there, that would be extraordinarily bullish. I also believe that more than likely we will see a lot of resistance above as the oversupply of oil could come back into play with higher pricing tempting more rigs in the United States and Canada.
Crude Oil Forecast Video 10.11.17
Brent
Brent markets went sideways as well, and tried to rally towards the end of the day. The $64 level is offering a bit of resistance that extends to the $65 handle. If we can break above the $65 handle, that would be a very bullish sign, prep sending the market much higher. In the meantime, I would anticipate a lot of sideways trading, with perhaps a little bit of a slightly upward bias. I think that the noise in this market will continue to be an issue, but it looks as if “buy the dips” continues to be the best way to deal with this market, on a short-term type of perspective.
About the Author
Christopher Lewisauthor
Chris is a proprietary trader with more than 20 years of experience across various markets, including currencies, indices and commodities. As a senior analyst at FXEmpire since the website’s early days, he offers readers advanced market perspectives to navigate today’s financial landscape with confidence.


Advertisement